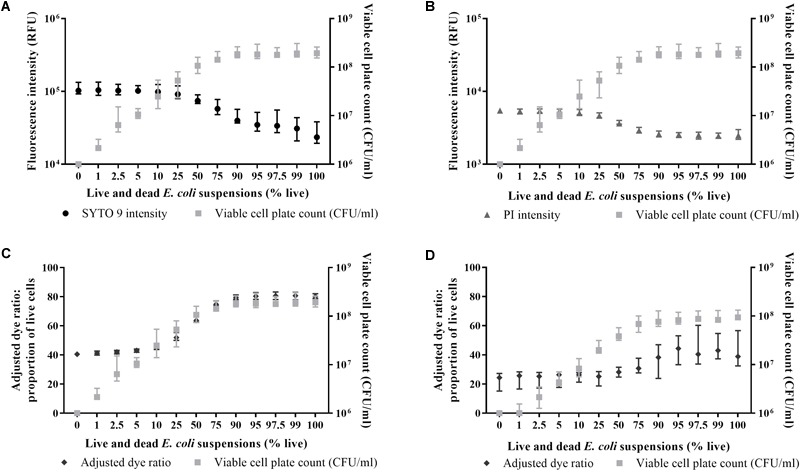
FIGURE 3.

Relationship between live/dead spectrometry and viable cell plate counts in minimal media and saline. SYTO 9 emissions in minimal media (A; circles), PI emissions in minimal media (B; triangles), the adjusted dye ratio in minimal media (C; diamonds), and the adjusted dye ratio in saline (D; diamonds) compared to viable cell plate counts (A–D; squares) for live and dead E. coli suspensions. Fluorescence intensity was obtained from integrating 505–515 nm and 600–610 nm. Data presented is the median with the range from six biological replicates.
