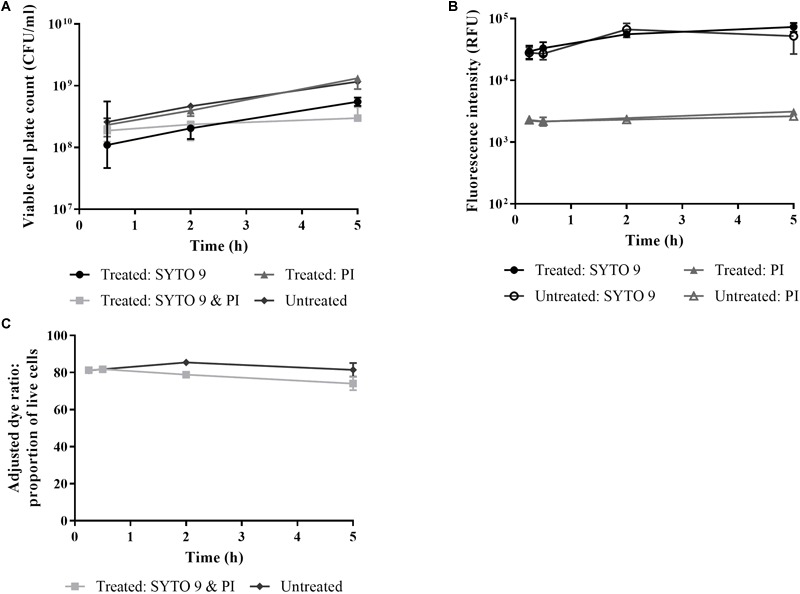
FIGURE 4.

The effect of live/dead staining on E. coli viability. E. coli cells in minimal media were stained with SYTO 9 and PI individually and in combination over time. Untreated cells were stained at each time point. At 0.25, 0.5, 2, and 5 h time points aliquots were taken for determination of cell viability by viable cell plate counts (A) and by measuring fluorescence of stained cultures (B,C). Fluorescence intensity was obtained from integrating 505–515 nm (circles) and 600–610 nm (triangles). The adjusted dye ratio (squares) was used to determine the % live. Data presented is the median with the range from three biological replicates.
