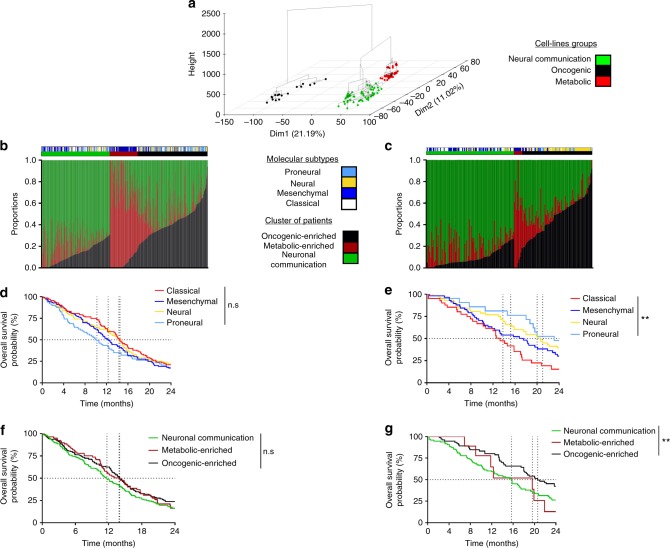
Fig. 2.
A new classification based on glioblastoma (GBM) cell lines. a Representation of the 129 cell lines samples on the two first dimensions of the principal components analysis. Three clusters were built by the hierarchical classification on principle components (HCPC) method. b, c Graph bar representing the quantities of cell lines groups the patients’ tumours. The patients were clustered based on these estimations using hierarchical clustering on the TCGA cohort (b) and Rembrandt’s cohort (c). d, e Kaplan–Meier estimates for overall survival (OS); patients from TCGA cohort (d) and Rembrandt cohort (e) were stratified according to the classical GBM classification. f, g Kaplan–Meier estimates for OS; patients from TCGA cohort (d) and Rembrandt cohort (e) were stratified according to the cell lines classification. **p < 0.01. ns not significant, TCGA the Cancer Genome Atlas

