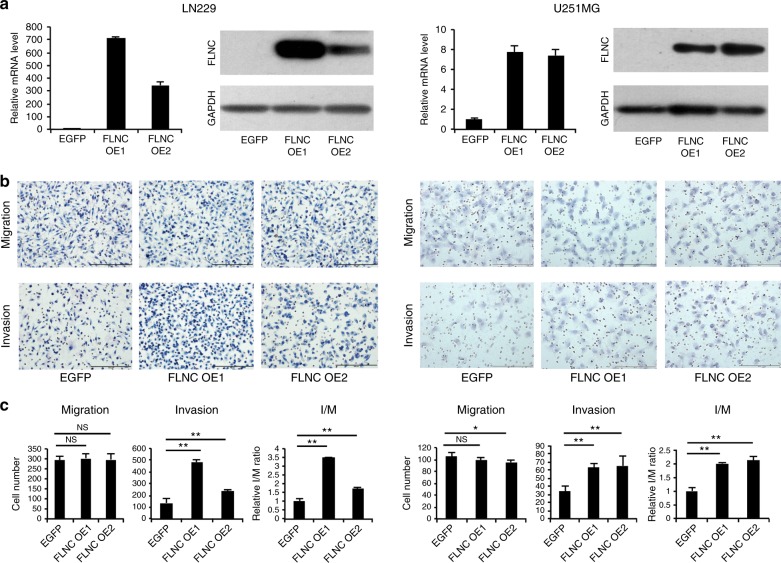
Fig. 2.
FLNC overexpression enhanced GBM cell invasion. a FLNC mRNA and protein levels in control and FLNC-overexpressing (OE) LN229 (left) and U251MG (right) cells, as determined by qRT-PCR and immunoblotting. GAPDH was used as a loading control. b Representative images from the Transwell migration and invasion assays of FLNC OE cells. Original magnification: ×200; scale bar: 500 μm. c Quantification of control and FLNC OE cell migration and invasion. I/M indicates the invasion/migration ratio. Columns represent total cell number in five independent microscopic fields and bars indicate SD. NS not significant; *P < 0.05; **P < 0.01. GBM glioblastoma multiforme, GAPDH glyceraldehyde 3-phosphate dehydrogenase

