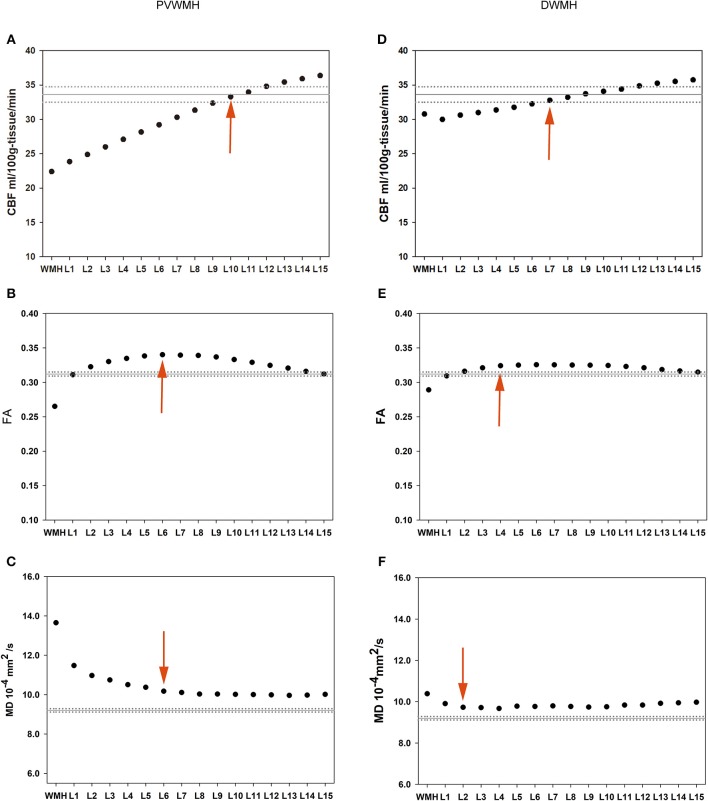
Figure 2.
Group means of the PVWMH (the left column) and DWMH (the right column) and their outer NAWM layers. The solid horizontal and dotted lines represent the mean and standard error of the whole-brain NAWM CBF, FA, and MD values, respectively. Red arrows represent the outer boundary of WMH penumbra for each dataset. (A) PVWMH-CBF; (B) PVWMH-FA; (C) PVWMH-MD; (D) DWMH-CBF; (E) DWMH-FA; (F) DWMH-MD.

