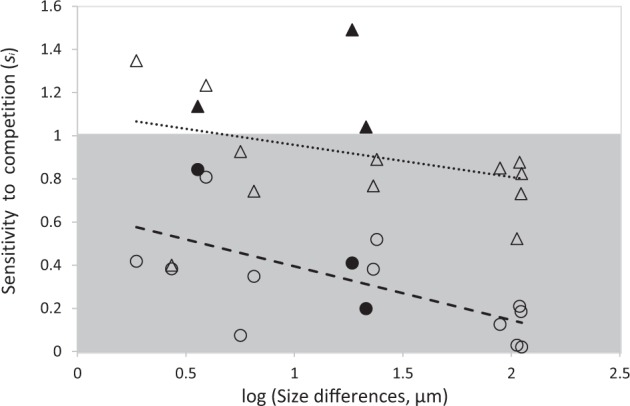
Fig. 4.

Effect of differences in cyanobacteria interspecific size on the sensitivity Si of each species in the pairwise combination, defined as Triangles represent the species with the highest sensitivity in each pair of species and circles represent the species with the lowest sensitivity in each pair of species. The gray area represents sensitivities comprised between zero and one, meaning that species in this area grew positively as invaders but less well than when grown alone. Sensitivities close to zero mean species grew as well as invaders as when alone. Sensitivities close, but below one mean species growth rates as invaders were still positive but low. Sensitivities above one mean species could not invade the resident population. The sensitivities of species with higher sensitivities were not influenced by size differences (upper line, R2 = 0.111, P = 0.225). The sensitivities of species with lower sensitivities decreased as the size differences increased (R2 = 0.416, P = 0.009). Filled symbols represent the three pairs of species for which the smallest species had a higher sensitivity than the larger species
