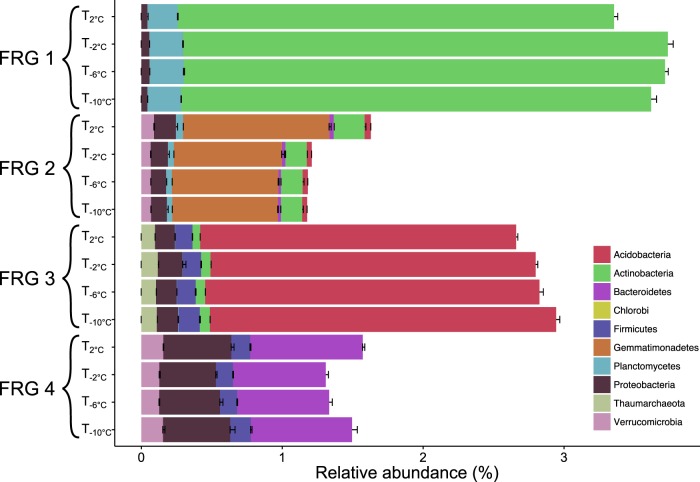
Fig. 5.
Composition and abundance of the four functional response groups (FRG) representing a group of organisms that respond similarly to environmental changes. The figure represents the weighted abundance of phylogenetic groups in each FRGs for each temperature during both thawing and freezing events. Statistical coherency of the four FRGs was verified under a Monte–Carlo simulation results, where random groups of the same size were sampled from the whole operational taxonomic unit (OTU) pool to test the robustness of defined FRGs (p < 1.0E-5)

