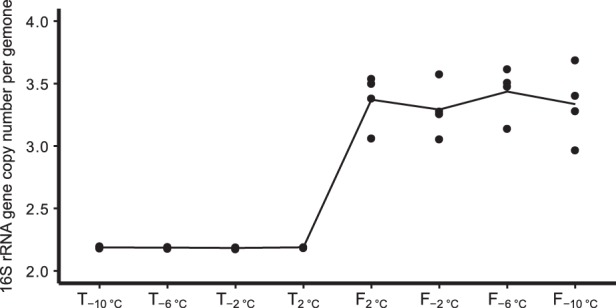
Fig. 6.

Mean 16S rRNA gene copy number per genome of the four replicates from each time point. Calculated as mean 16S rRNA gene copy number weighted by the relative abundances of each operational taxomomic unit (OTU) based on the PICRUSt pipeline

Mean 16S rRNA gene copy number per genome of the four replicates from each time point. Calculated as mean 16S rRNA gene copy number weighted by the relative abundances of each operational taxomomic unit (OTU) based on the PICRUSt pipeline