
Fig. 7.
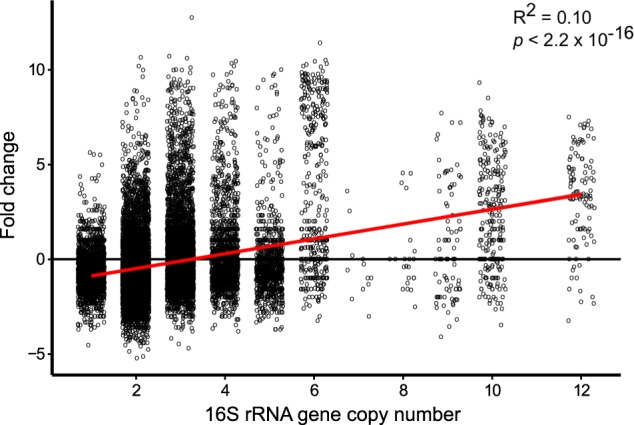
Dot plot of the log2-fold change between T2°C and F2°C and the 16S copy number for each operational taxonomic unit (OTU) based on the PICRUSt pipeline. Red line are linear regression
Official websites use .gov
A
.gov website belongs to an official
government organization in the United States.
Secure .gov websites use HTTPS
A lock (
) or https:// means you've safely
connected to the .gov website. Share sensitive
information only on official, secure websites.
Dot plot of the log2-fold change between T2°C and F2°C and the 16S copy number for each operational taxonomic unit (OTU) based on the PICRUSt pipeline. Red line are linear regression