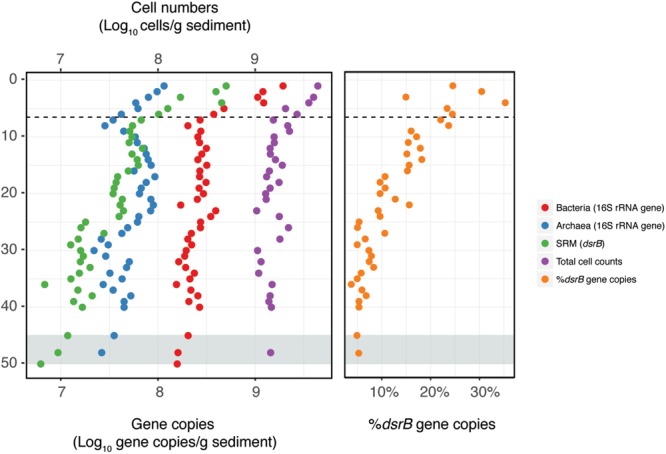
FIGURE 2.

Distribution of microbial abundances with depth. Bacterial, archaeal, and sulfate reducing microorganisms (SRM) were quantified by qPCR. Total cell counts (TCC) were quantified by direct epifluorescence microscopy of microbial cells. The dashed line indicates the depth of the bottom of the bioturbation zone and the gray shading indicates the onset of the SMT.
