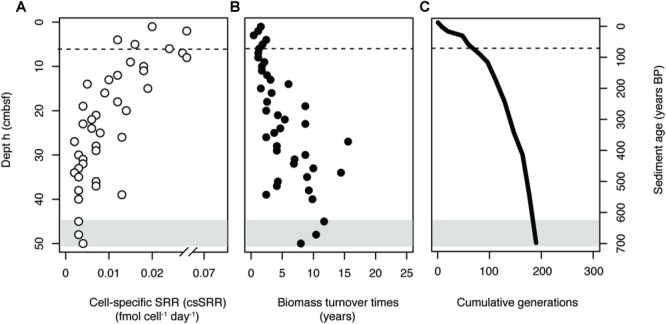
FIGURE 6.

(A) Estimates of cell-specific sulfate reduction rates (csSRR) in the sediment core. (B) Estimated biomass turnover times of the total SRM community. (C) Cumulative generations possible throughout the sediment core. All values were estimated using dsrB gene copy numbers as a proxy for SRM abundance, assuming a 7% DNA extraction efficiency. Gray shading indicates the onset of the SMT. Dashed lines in the surface indicate the bottom of the bioturbation zone.
