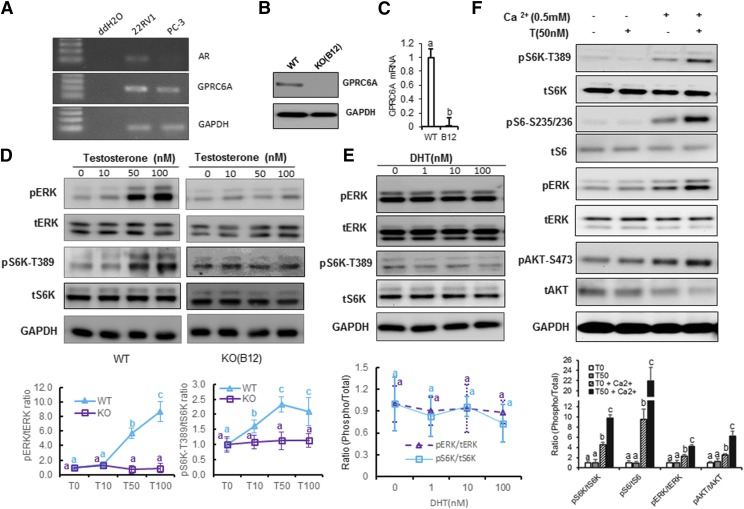
Fig. 1.
GPRC6A directly mediated in testosterone-induced mTORC1 activation. (A) Reverse transcription polymerase chain reaction (PCR) analysis of AR and GPRC6A expression in PC-3 cells. 22Rv1 was employed as a positive control for the AR and GPRC6A expression human prostate cancer cell line. (B) Establishment of GPRC6A KO (B12) cell line by the CRISPR/Cas9 system. Western blot analysis of GPRC6A protein level in WT PC-3 cells (with Cas9 expression but no short guide RNA insert) and GPRC6A KO (B12) cells. (C) Real-time PCR of GPRC6A expression in WT PC-3 or KO PC-3 cells. Data are presented as mean ± S.D. Each independent experiment was performed and replicated six times (n = 3). Different letters in the superscripts above the data points indicate significant differences between groups. Values sharing the same superscript letters are not significantly different from each other, and values with different superscript letters indicate significant differences between groups (P < 0.05, Student’s t test.) (D) Knockout of GPRC6A abolished testosterone-induced mTORC1 activation. PC-3 WT cells and GPRC6A KO (B12) cells were treated with different concentrations of testosterone. Cells were incubated in Hanks’ balanced salt solution (HBSS) buffer for 2 hours before 20-minute testosterone stimulation. Data are presented as mean ± S.D. Each independent experiment was performed in biologic triplicates (N = 3). Statistical differences between groups are indicated by superscript letters (P < 0.05, two-way ANOVA with Tukey’s multiple comparisons test), as described for (C). (E) PC-3 cells were incubated in HBSS buffer for 2 hours before 20-minute treatment with dihydrotestosterone (DHT) at different concentrations. No activation is seen by DHT treatment. Statistical differences between groups are indicated by superscript letters, as described in (D). (F) Ca2+ is essential for the activation of mTORC1 and ERK and Akt phosphorylation. PC-3 cells were incubated in HBSS buffer with or without 0.5 mM Ca2+ for 2 hours before 20-minute testosterone stimulation. PC-3 cells were stimulated with HBSS buffer in the presence or absence of 0.5 mM Ca2+. Statistical differences between groups are indicated by superscript letters, as described in (D).

