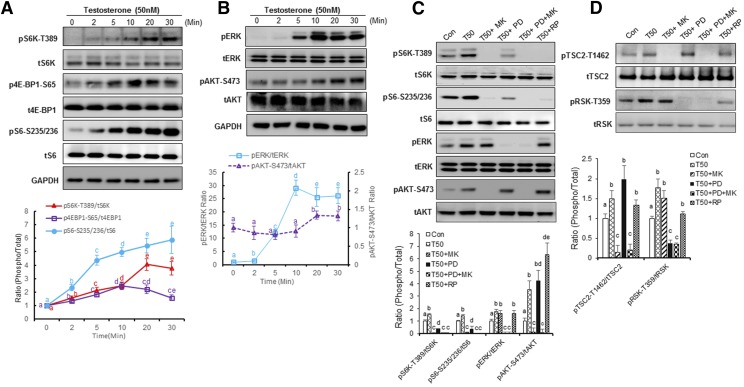
Fig. 2.
Testosterone regulated mTORC1 signaling via ERK and Akt signaling. (A) Time dependence of testosterone-activated mTORC1 signaling. PC-3 cells were assessed at different times after addition of testosterone at a concentration of 50 nM. Data are presented as mean ± S.D. Each independent experiment was performed in biologic triplicates (n = 3). Different letters in the superscripts above the data points indicate significant differences between groups. Values sharing the same superscript letters are not significantly different from each other, and values with different superscript letters indicate significant differences between groups (P < 0.05, two-way ANOVA with Tukey’s multiple comparisons test). (B) Time-dependent testosterone activation of ERK and AKT phosphorylation. PC-3 cells were incubated in Hanks’ balanced salt solution (HBSS) buffer for 2 hours before testosterone (50 nM) stimulation. ERK and AKT activation was analyzed by western blot. Statistical differences between groups are indicated by superscript letters, as described in (A). (C and D) Testosterone-induced mTORC1 signaling activation is inhibited by mTOR, AKT, or ERK inhibitors. PC-3 cells in HBSS were treated with MK2206 [(MK), 1 mM] and/or ERK inhibitor 2′-Amino-3′-methoxyflavone [PD98059(PD), 10 μM], rapamycin [(RP), 100 nM] for 20 minutes. PC-3 cells were incubated in HBSS buffer for 2 hours before 20-minute testosterone stimulation. Statistical differences between groups are indicated by superscript letters, as described in (A).

