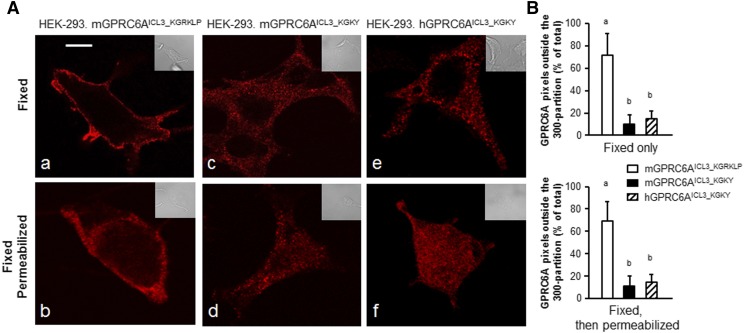
Fig. 4.
Cellular compartmentalization of the various GPRC6A constructs in HEK-293 cells. (A) Distribution of the various GPRC6A constructs in HEK-293 cells. Fluorescence confocal microscopy of cells expressing the indicated GPR6A constructs that were either fixed (images a, c, and e) or fixed and then permeabilized (images b, d, and f). The distribution of pixels was obtained by confocal microscopy and the colors shown are pseudo colors, while the inset represents Nomarski images that were acquired at the same magnification. These images are representative of images derived from three separate experiments with 10 aggregate images per condition. Scale bar, 5 μm. (B) Digitized difference GPRC6A membrane location. Data are mean ± S.D. of GPRC6A pixels outside a 300-nm partition derived from 30 images derived from n = 3 experiments. Different letters in the superscripts above the data points indicate significant differences between groups. Values sharing the same superscript letters are not significantly different from each other, and values with different superscript letters indicate significant differences between groups (P < 0.05, two-way ANOVA with Tukey’s multiple comparisons test).

