FIGURE 1.

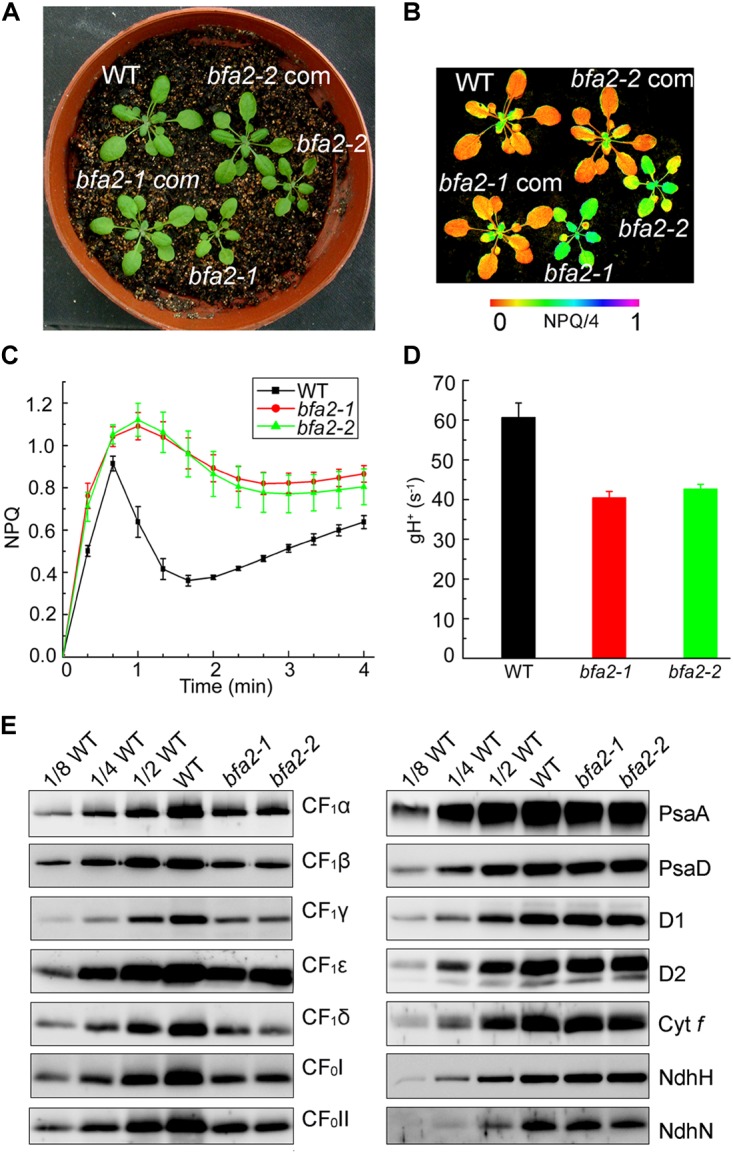
Identification and characterization of the bfa2 mutants. (A) Phenotype of the bfa2 mutants. bfa2-1 com and bfa2-2 com, complemented lines with overexpression of BFA2 in bfa2-1 and bfa2-2, respectively. (B) Image of NPQ. The image was captured upon illumination (80 μmol photons m-2 s-1) for 2 min. Values for NPQ/4 are indicated at the bottom on a false color scale. (C) Time course of NPQ induction. NPQ induction kinetics was measured upon illumination with AL (Actinic light) light (80 μmol photons m-2 s-1) for 4 min. Means ± SD (n = 4). (D) H+ conductivity through ATP synthase (gH+) under an irradiance of 628 μmol photons m-2 s-1. Means ± SD (n = 4). (E) Immunoblot analysis of the thylakoid membrane proteins in bfa2 and WT plants. Proteins were loaded on an equal chlorophyll basis and blots were probed with the indicated antibodies.
