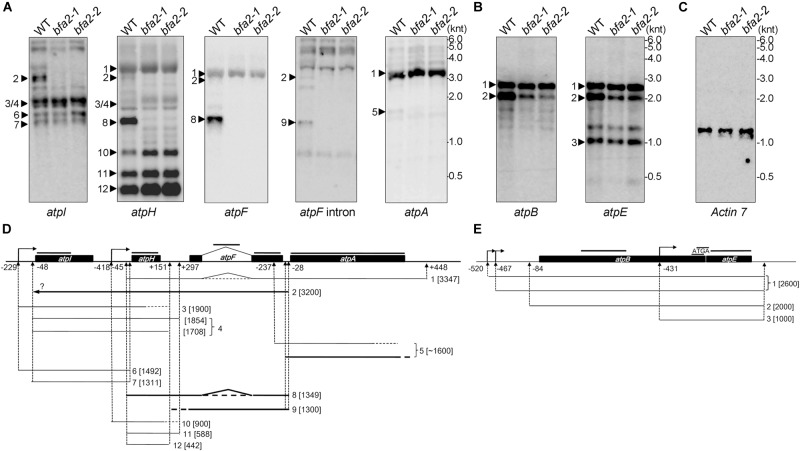
FIGURE 3.
RNA blot analysis of the plastid-encoded ATP synthase genes. (A–C) Total RNA isolated from WT and bfa2 mutants was probed with digoxigenin-labeled probes corresponding to the genes in the large (A) and small (B) atp operons. A blot with the Actin 7 probe was used as a loading control (C). The positions of RNA markers are shown in kilonucleotides (knt). (D,E) Partial transcript map of the atpI/H/F/A (D) and atpB/E (E) operons in Arabidopsis. The map was generated based on the transcript size in (A,B) as well as on previous reports (Malik Ghulam et al., 2012, 2013). Transcripts absent in bfa2 are shown as bold black lines. The positions of the probes are indicated above the operons. The numbers refer to the distance upstream of the initiation codon (-) and downstream of the termination codon (+).

