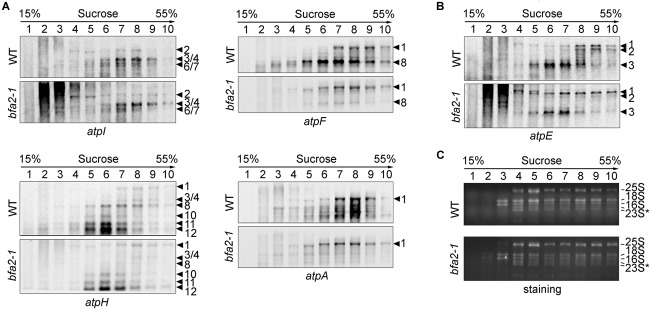
FIGURE 4.
Analysis of polysome association of the plastid transcripts encoding ATP synthase subunits. (A,B) Total leaf extracts from wild-type and bfa2-1 plants were fractionated by centrifugation on 15–55% sucrose density gradients. After centrifugation, the sucrose gradients were divided into 10 fractions of equal volume for RNA isolation. The isolated RNAs were blotted with DIG-labeled DNA probes corresponding to the plastid atpA, atpF, atpH, and atpI (A) as well as atpE (B) transcripts. The numbers to the right of the panels correspond to the corresponding transcripts illustrated in Figure 3D,E. (C) Staining of the rRNA was used as fractionation and loading control. 23S∗, two breakdown products of the chloroplast 23S rRNA. The numbers on the right indicate sedimentation coefficients of the major rRNAs.

