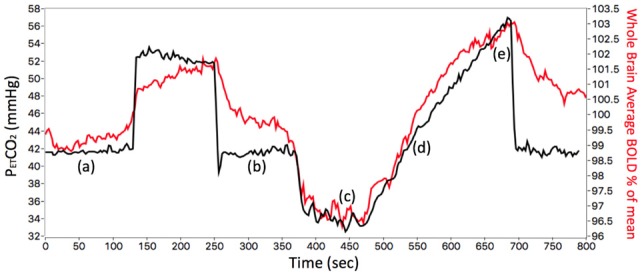
Figure 2.

The stimulus sequence for a representative control subject (ID 26, F, 38). The PETCO2 stimulus (black line) and whole brain average BOLD voxel response (red line) are shown. The first part of the stimulus, between points (a) and (b), consisted of a step change used to measure time delay reported previously (12). The subject’s resting PETCO2 of 41 mmHg (a) was increased by 10 mmHg for 2 min then returned to resting PETCO2 (b). The ramp portion shown between points (c) and (e) was used for assessing the resistance response. The subject’s resting PETCO2 was decreased by 10 mmHg (c) and then slowly increased to resting PETCO2 (d), further increased to ~15 mmHg above resting (e), and returned to resting PETCO2.
