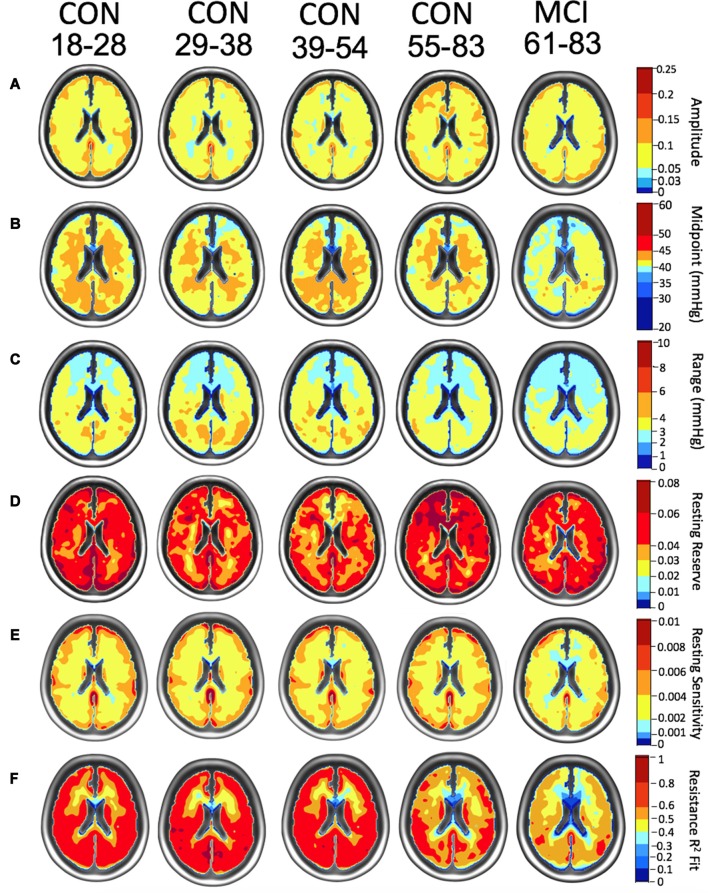
Figure 3.
Axial atlas images of resistance parameters for each age group of the control subjects (CON) and the mild cognitive impairment (MCI) patient group are depicted using nonlinear color scales. (A) Resistance sigmoid amplitude maps show increasing amplitudes from dark blue to light blue then yellow to dark red. (B) Resistance sigmoid midpoint maps (mmHg) show midpoints above (yellow to dark red) and below (light to dark blue) the reference resistance sigmoid midpoint. (C) Resistance sigmoid range maps show increased (yellow to dark red) and decreased (light to dark blue) linear ranges in mmHg. (D) Resistance resting reserve, the vasodilatory ability from healthy resting PETCO2, is shown with the amplitude color scale. (E) Resistance resting sensitivity, the sigmoid slope at healthy resting PETCO2, is also shown with the amplitude color scale. (F) Resistance r2 fit also uses a similar color scale.

