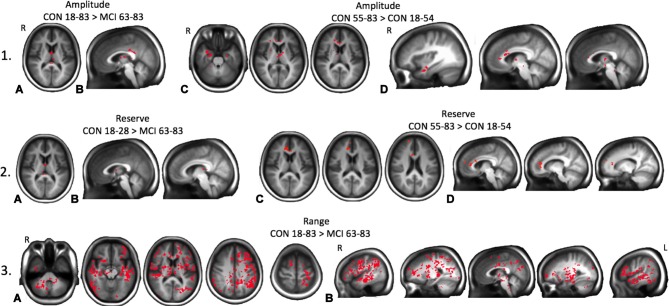
Figure 4.
Maps of significant differences between groups for resistance amplitude, reserve, and range determined from threshold-free cluster enhancement (TFCE) analysis are shown as red clusters. (1A) Axial and (1B) sagittal views showing significantly reduced amplitudes in the MCI patient group compared to all control groups combined. (1C) Axial and (1D) sagittal views of significantly reduced amplitudes in the youngest control group compared with the oldest control group. (2A) Axial and (2B) sagittal views showing significantly reduced resting reserve in the MCI patient group compared with the youngest control group. (2C) Axial and (2D) sagittal views showing significantly reduced resting reserve in the combined younger control groups compared with the oldest control group. (3A) Axial and (3B) sagittal views showing significantly reduced resistance sigmoid range in the MCI patient group compared with all healthy control groups combined, ps < 0.05.

