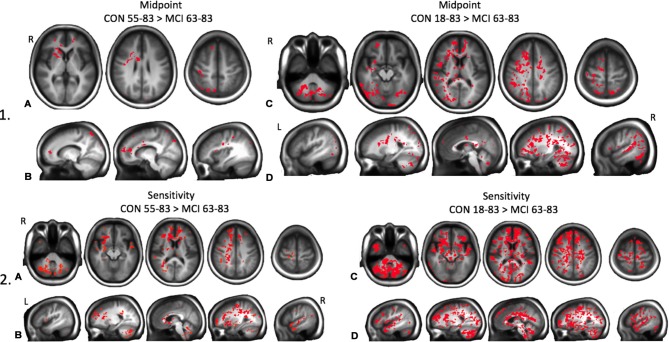
Figure 5.
Maps of significant differences between groups for resistance sigmoid midpoints and sensitivities determined from TFCE analysis are shown as red clusters. (1A) Axial and (1B) sagittal views of significantly decreased midpoints for the MCI patient group compared to the oldest healthy control group. (1C) Axial and (1D) sagittal views of significantly decreased midpoints in the MCI patient group compared to all healthy control groups combined. (2A) Axial and (2B) sagittal views of significantly decreased sensitivity in the MCI patient group compared to the oldest healthy control group. (2C) Axial and (2D) sagittal views of significantly decreased sensitivity in the MCI patient group compared to all healthy control groups combined, ps < 0.05.

