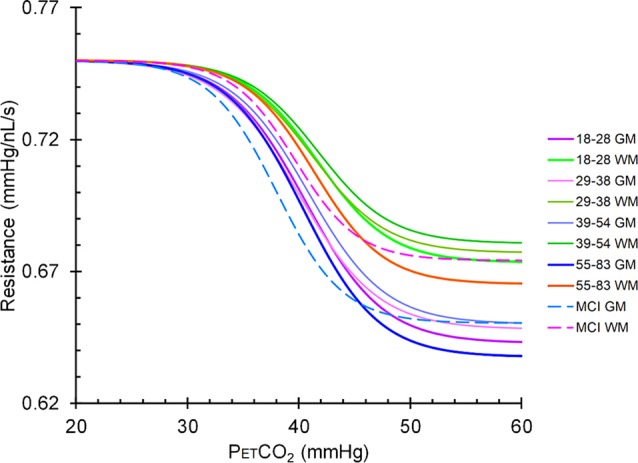
Figure 6.

Mean resistance sigmoids for gray matter (GM) and white matter (WM) in the MCI patient group and the healthy control groups. The upper group of sigmoidal curves is in WM and the lower set are in GM. Solid lines represent the sigmoidal curves in healthy controls broken down by age cohort, and dashed lines represent the sigmoidal curves in the MCI patient group.
