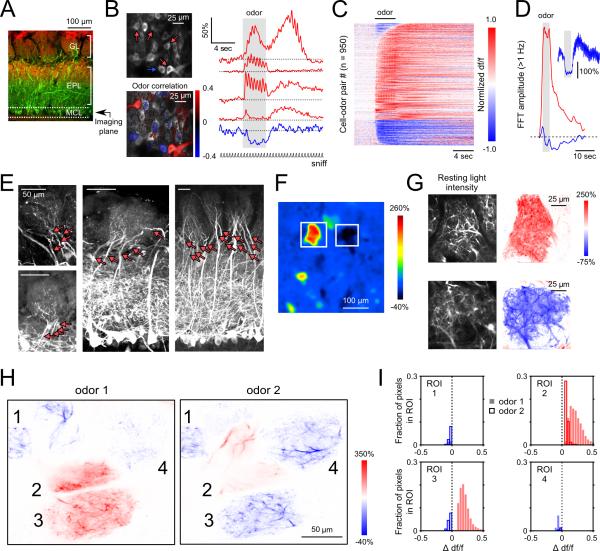
Figure 3. Excitatory and suppressive odorant responses are interspersed among pcMT cell somata and are shared across sister pcMT cells in the same glomerulus.
A. Reference image indicating imaging plane targeting pcMT somata.
B. pcMT cells imaged in vivo (top left) and fluorescence time series (right) from select somata showing distinct temporal patterns including fluorescence increases (red) and decreases (blue). Traces are averages of 4 trials. Excited cells with activity positively correlated with odorant presentation were interspersed with negatively correlated (suppressed) cells (different odorant; lower left). Note that stimulus-activity correlations reveal the polarity of the odorant response but do not quantify similarity between the responses of individual somata.
C. Odorant-evoked GCaMP signals across a population of cell-odor pairs, displayed as in Figs. 1 and 2.
D. Time-course of high-frequency power (summed FFT amplitude > 1 Hz) across all excited (red) and suppressed (blue) somata demonstrates a sustained decrease in high-frequency fluctuations following the initial suppressive transient.
E. Example confocal images from histological sections showing innervation of glomeruli by multiple pcMT cells. Note that fluorescence is comparatively dim in the glomerular layer. All images show native GCaMP fluorescence with no enhancement by immunostaining.
F. GCaMP fluorescence imaged from the glomerular layer in vivo illustrating excitation and suppression in two neighboring glomeruli in response to the same odorant (methyl benzoate).
G. High-resolution imaging from the excited (top) and suppressed (bottom) glomeruli indicated in (F). Left images show individual dendritic processes resolvable within each glomerulus; right images show corresponding pixel-wise df/f maps. All responsive processes within a glomerulus show either a positive (red; excited) or negative (blue; suppressed) response to the odorant.
H. High-resolution response maps showing resolvable dendritic processes within a group of glomeruli. All dendritic processes within a given glomerulus respond with the same polarity, even for glomeruli that respond with different polarity to different odorants (e.g. glomerulus 3). ‘Odor 1’, ethyl butyrate; ‘Odor 2’, 2-hexanone.
I. Histograms of changes in df/f values for every significantly modulated pixel within each glomerulus indicated in (H) for two odors (solid bars and open bars). Glomeruli with intermingled excitatory and suppressive responses were never observed.

