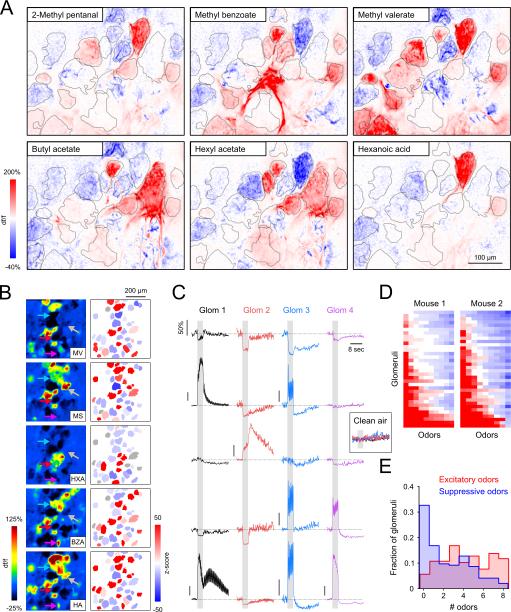
Figure 4. Glomerular response polarities are highly interspersed and odorant-specific.
A. Maps of glomerular MT cell responses (GCaMP6f) evoked by six odorants imaged across the same field of view in an anesthetized mouse. Red and blue indicate fluorescence increases and decreases, respectively. Glomeruli are outlined in gray. Most glomeruli were excited, suppressed, and unresponsive to distinct subsets of the odorant panel.
B. Glomerular activation maps (left) evoked by five odorants known to strongly-activate the dorsal OB, with ROI masks pseudocolored by response z-score (right). In all cases, excited (red), suppressed (blue) and non-responsive (gray) glomeruli are intermingled. MV, methyl valerate; MS, methyl salicylate; HXA, hexanoic acid; BZA, benzaldehyde; HA, hexyl acetate.
C. Time series corresponding to the four glomeruli indicated with arrows in (B) for each of the five odorants. The polarity and time course of each response is glomerulus- and odorant-specific. Responses were abolished when clean air was used a stimulus (inset). Scale bar top left applies to all traces except where indicated (all represent 50% df/f).
D. Response matrix representing the strength and polarity of odor-evoked responses in two different mice. Responses were sorted across rows from most excitation to most suppression left-to-right for ease of visualization. As a result, odorant identity is not preserved across columns. Most glomeruli exhibited excitatory and suppressive responses to subsets of the odorants tested. Odorants not eliciting a detectable response are colored white.
E. Histogram of the number of odorants eliciting excitation and suppression across all glomeruli, assayed with panels of 8 odorants known to strongly activate the dorsal OB.

