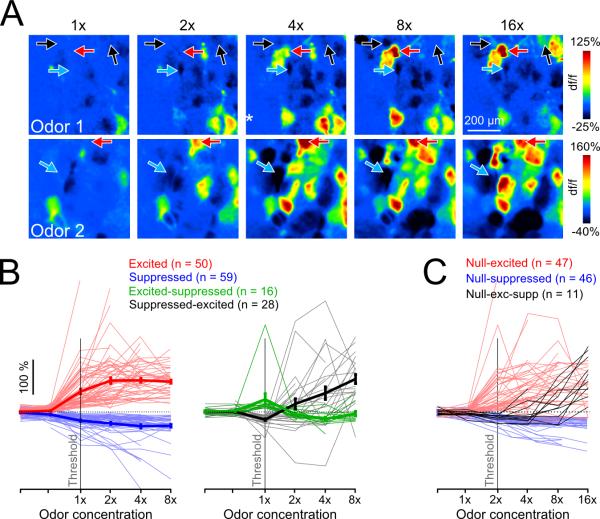
Figure 5. Glomeruli show diverse patterns of pcMT excitation and suppression across odorant concentration.
A. Pseudocolor df/f maps of glomerular responses to increasing odorant concentration from two representative experiments (Odor 1, ethyl butyrate; Odor 2, methyl valerate). Arrows indicate glomeruli that transition from unresponsive to excitation at higher concentration (red), unresponsive to suppression (blue), and unresponsive to suppression and then to excitation (black).
B. Responses of all glomeruli to the same odorant across a range of concentrations. The majority of glomeruli responded with the same polarity across all concentrations (71%; 109/153), and are shown in the left plot. Glomeruli showing changes in response polarity with increasing concentration are shown in the right plot. Data points to the left of ‘1×’ represent further decreased concentrations and/or blank stimuli.
C. Responses of glomeruli exhibiting a null response to at least one low concentration of the odorant. The first suprathreshold response in nearly half of all glomeruli (47/104) was excitatory.

