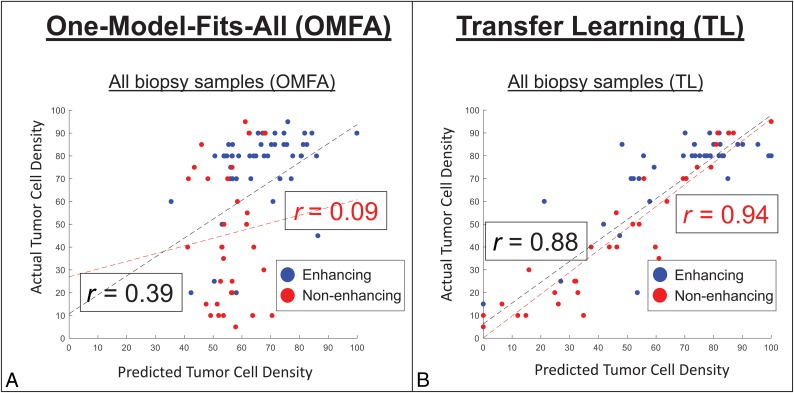
Fig 1.
Transfer learning improves predictive performance for quantifying TCD. Scatterplots show the correlations between actual (y-axis) versus-model-predicted (x-axis) tumor cell densities using multivariable modeling (rCBV, T1 + C, MD, and FA) and the generalized (A) OMFA versus the individualized (B) TL approaches. Blue and red dots denote biopsy samples from enhancing (n = 49) and nonenhancing (n = 33) regions, respectively. Regression lines and Pearson correlations (r) are shown for all 82 samples (black lines and text) versus only the 33 nonenhancing samples (red lines and text). Correlations using TL are significantly higher compared with the generalized OMFA approach.

