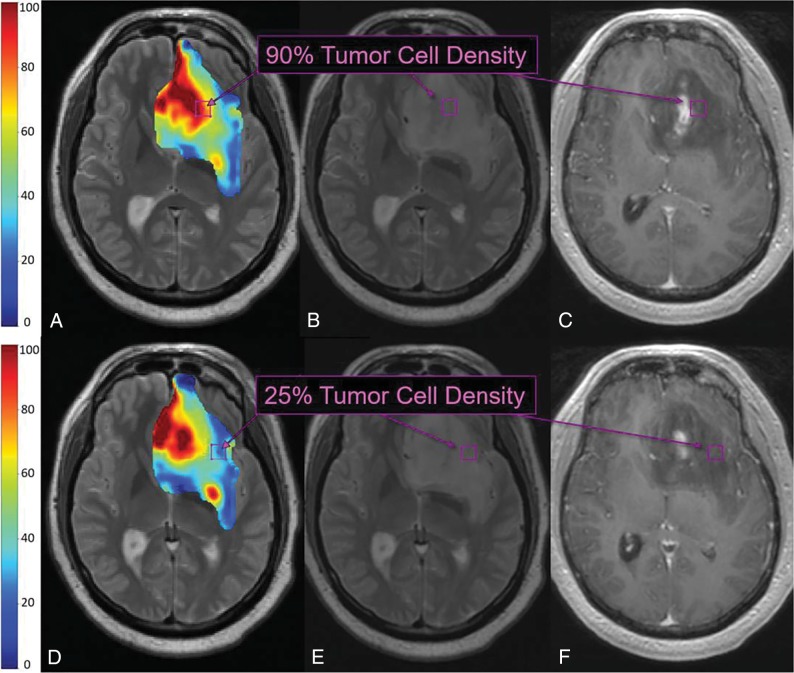
Fig 2.
TL maps and multiple biopsies in a 71-year-old patient with primary GBM. TL-based color map overlay on a T2-weighted image (A) shows predicted regional TCD ranging from 0% to 100% (blue to red) throughout the segmented tumor region (based on the T2-weighted signal abnormality). Histologic analysis of the top biopsy (purple boxes B and C) yielded 90% TCD, corresponding to red regions of high TL-predicted TCD (purple box, A). TL-based color map (D) from a more caudal T2-weighted slice shows blue regions of low TL-predicted TCD (blue/green, purple box), corresponding to 25% TCD on histologic analysis of the bottom biopsy (purple boxes, E and F).

