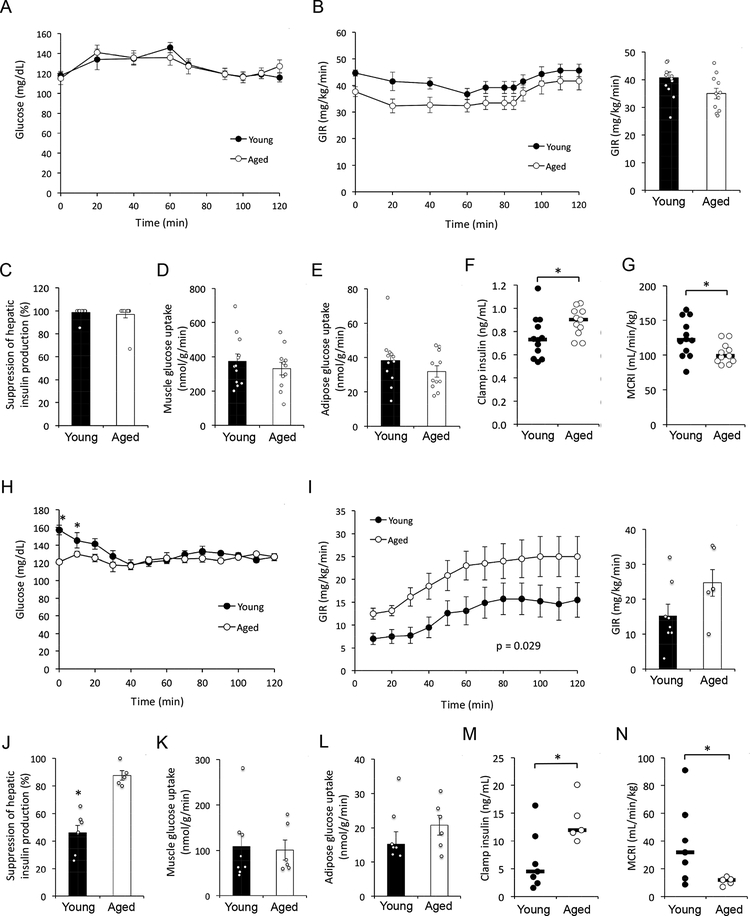
Figure 2 –
(A-G) Hyperinsulinemic-euglycemic clamp results in young (n = 12; 8 months of age) and aged (n = 11; 27 months of age) male C57BL/6J mice on chow diet. (H-N) Hyperinsulinemic-euglycemic clamp results in young (n = 7; 6 months of age) and aged (n = 5; 24 months of age) diet-induced obese male C57BL/6J mice. (A and H) Blood glucose levels. (B and I) Glucose infusion rate (GIR) during the clamp (left panel) and at steady state (80–120 min; right panel). P value corresponds to the effect of ‘Age’ factor in 2-way repeated measures ANOVA. (C and J) Suppression of hepatic glucose production. (D and K) Skeletal muscle glucose uptake. (E and L) Adipose tissue glucose uptake. (F and M) Plasma insulin levels during the final 20 min (100–120 min) of the clamp. (G and N) Metabolic clearance rate of insulin (MCRI) during the final 20 min of the clamp. (A-E and H-L) Data are presented as mean ± SEM. *, p < 0.05; comparison by Student’s t-test. (F-G and M-N) Horizontal bars represent median. *, p < 0.05; comparison by Mann-Whitney U test.

