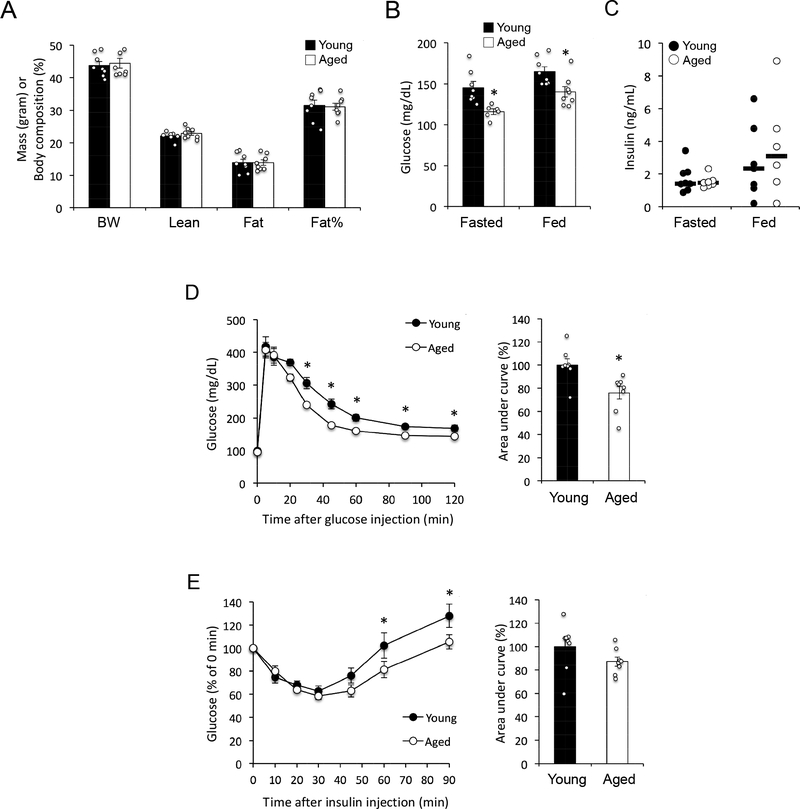
Figure 3 –
(A) Body weight (BW) and composition of young (6 months) and aged (24 months) mice (n = 8 mice per group) after 9 weeks of HF diet feeding. Vertical axis shows mass in grams for BW, Lean and Fat, or body composition as percentage of fat for Fat%. (B) Blood glucose levels in 5-hour fasted (n = 8 young + 6 aged mice) and ad libitum fed (n = 8 mice per group) mice. *, p < 0.05; comparison by Student’s t-test. (C) Plasma insulin levels in 5-h fasted (n = 8 young + 7 aged mice) and ad libitum fed mice (n = 7 young + 6 aged mice). Horizontal bars represent median. (D) Glucose tolerance test (n = 8 mice per group). *, p < 0.05; comparison by 2-way repeated measures ANOVA (left panel) or Student’s t test (right panel). (E) Insulin tolerance test (n = 8 mice per group). *, p < 0.05; comparison by 2-way repeated measures ANOVA.

