
Figure 4.
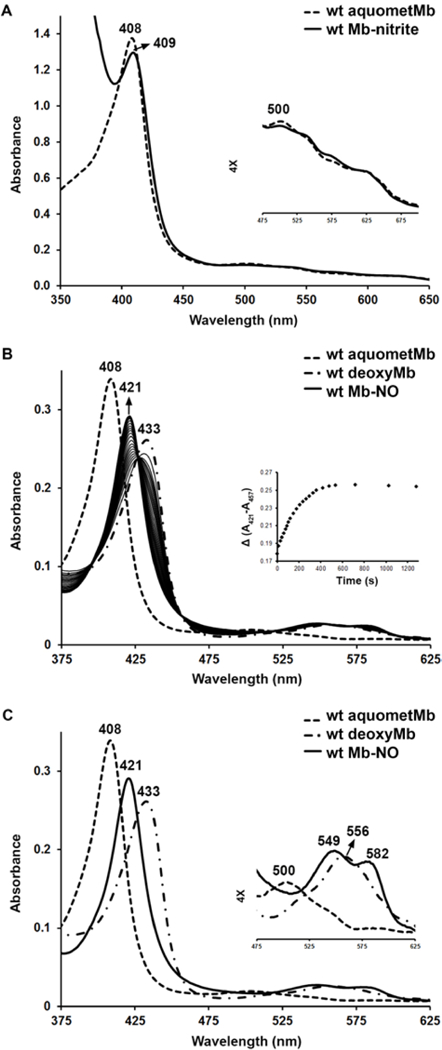
UV-vis spectral monitoring of the reactions of ferric wt sw MbIII–H2O. (A) changes after addition of nitrite. (B) changes after addition of dithionite followed by the addition of nitrite as well as the plot of ΔAbs(421–457) against time. (C) UV-vis spectra of the three forms of wt sw Mb (ferric, deoxy ferrous, and NO) with the enlarged Q region. Conditions: 0.1 M phosphate buffer, pH 7.4, [protein] = 1.8–7.4 μM, [nitrite] in (A) = 40 mM, [dithionite] = 5 mM, [nitrite] in (B) and (C) = 4 mM.