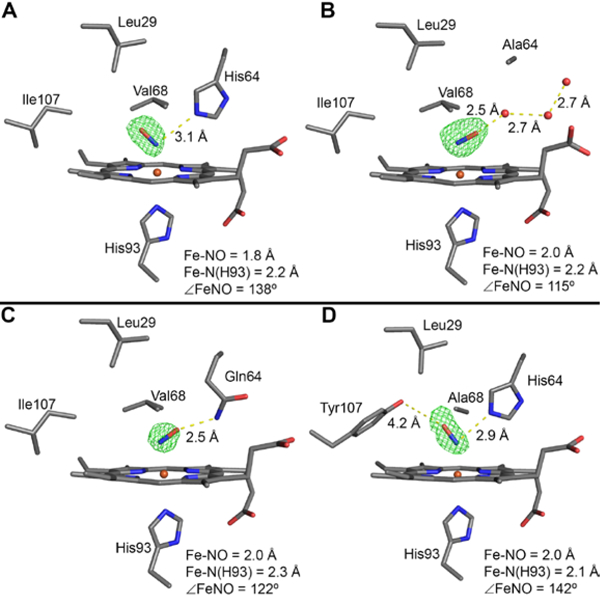
Figure 8.

The Fo–Fc omit electron density map (green mesh, contoured at 3σ) and final model of the heme active site of the ferrous sw MbII–NO derivatives. (A) wt MbII–NO at 1.70 Å resolution (PDB ID: 5JNG), (B) H64A MbII–NO at 1.78 Å resolution (PDB ID: 5JNI), (C) H64Q MbII–NO at 1.78 Å resolution (PDB ID: 5JNJ), (D) V68A/I107Y MbII–NO at 1.79 Å resolution (PDB ID: 5JNK). The 2Fo–Fc maps are shown in Figure S10.
