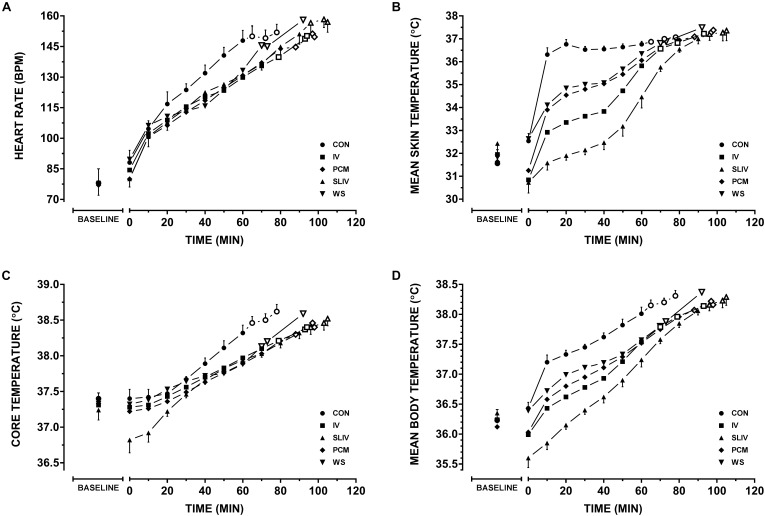
FIGURE 2.
Physiological variables across personal cooling systems. Comparisons between control and all other conditions for (A) heart rate, (B) mean skin temperature, (C) rectal temperature, and (D) mean body temperatures during work. Baseline resting data (BASELINE); time walking up to 120 min (Mean ± SD) – for each condition filled markers represent (n = 8) participants plotted at 10 min intervals, thereafter, an open marker represent a participant dropping out until n = 5. CON, control; IV, ice vest; SLIV, slurry and ice vest; PCM, phase change material; WS, water-perfused suit.

