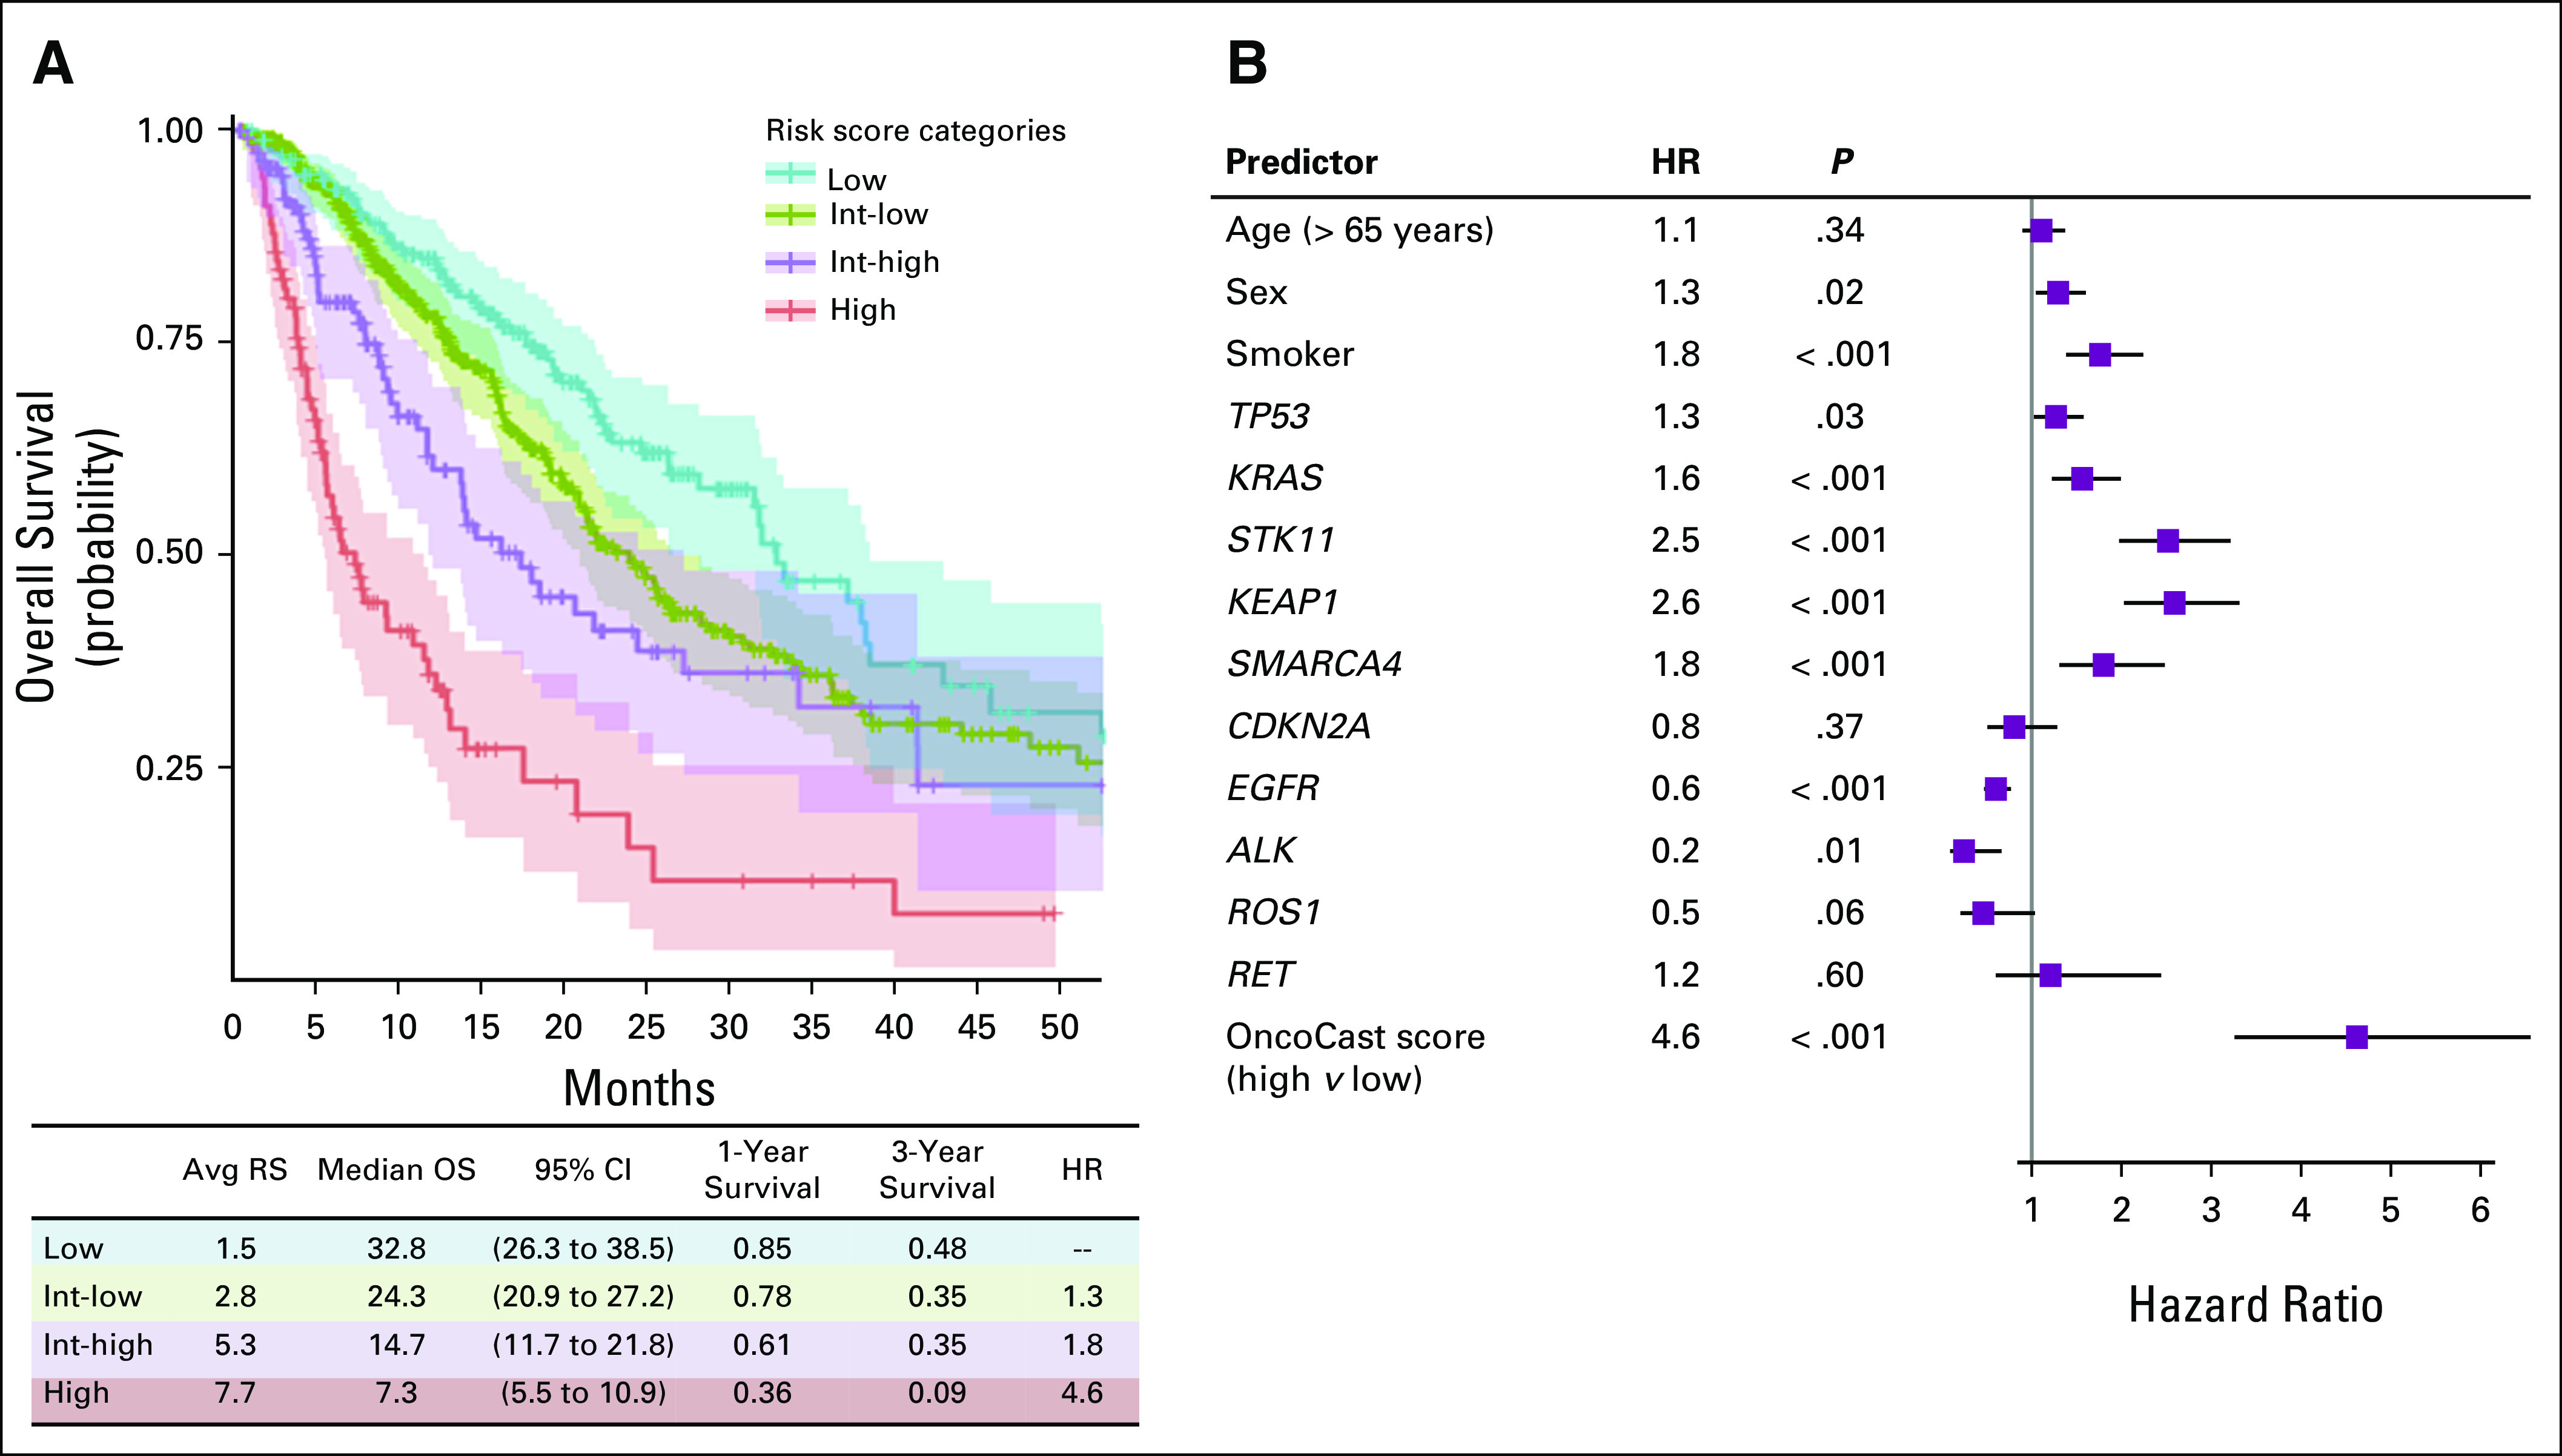
FIG 3.

Outcome prediction on the basis of risk score. (A) Kaplan-Meier plot of survival curves for the four risk subgroups (Low, intermediate-low [Int-low], intermediate-high [Int-high], and high). Colored areas represent 95% CIs. The average risk score (Avg RS), median overall survival (OS), and 1-year and 3-year survival probabilities are reported for each group. (B) Forest plot of hazard ratios (HRs) for age, sex, smoking status, and individual driver gene alterations compared with the OncoCast integrated scoring approach.
