
Figure 6: ZIKV NS4A interacts with Ankle2 and affects neuroblasts.
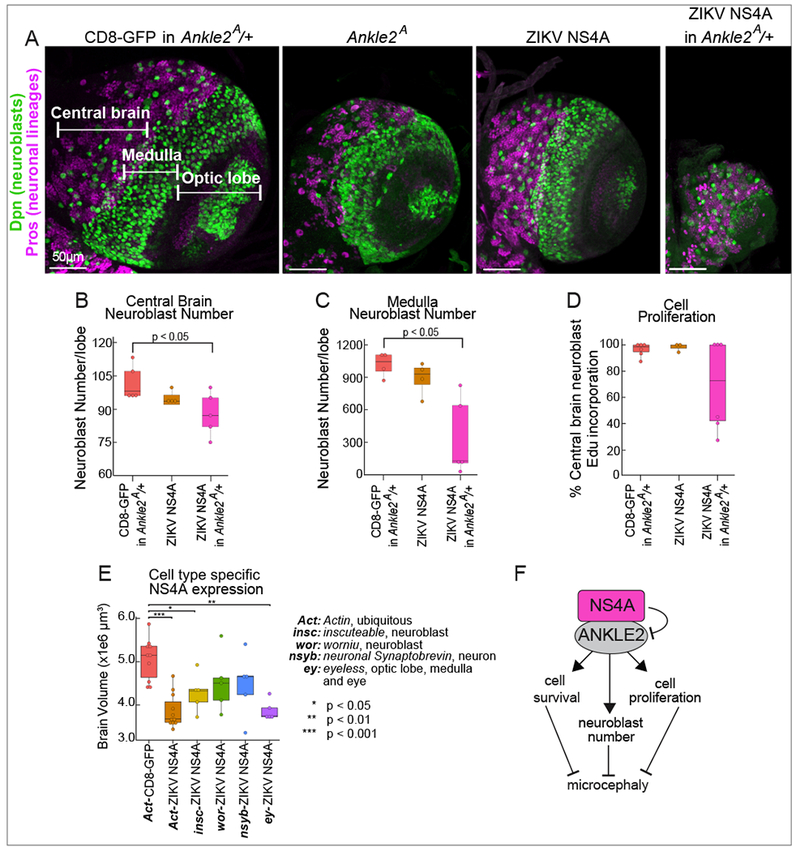
(A) 3rd instar larval brains from animals expressing the indicated proteins ubiquitously (driven by Act-GAL4), and stained for neuroblasts (Dpn, green) and neuronal lineages (Pros, purple) in control animals (CD8-GFP in Ankle2A/+), Ankle2A/Y males, NS4A, or NS4A in Ankle2A/+ animals. The CD8-GFP in control animals was not imaged. Scale bar 50 βm. (B) and (C) Quantification of neuroblasts in brains expressing the indicated proteins using total number of Dpn positive cells in the central brain (B) and medulla (C). (D) Central brain neuroblast proliferation was quantified in brains expressing the indicated proteins based on EdU incorporation in Dpn positive cells. (E) Brain volumes quantified from animals expressing the indicated construct with the indicated driver to test cell type specificity. P values were calculated using one-way ANOVA, Sidak’s multiple comparisons test. Act-NS4A was also shown in Figure 5C. (F) Model of ZIKV NS4A impact on ANKLE2 function and brain development.