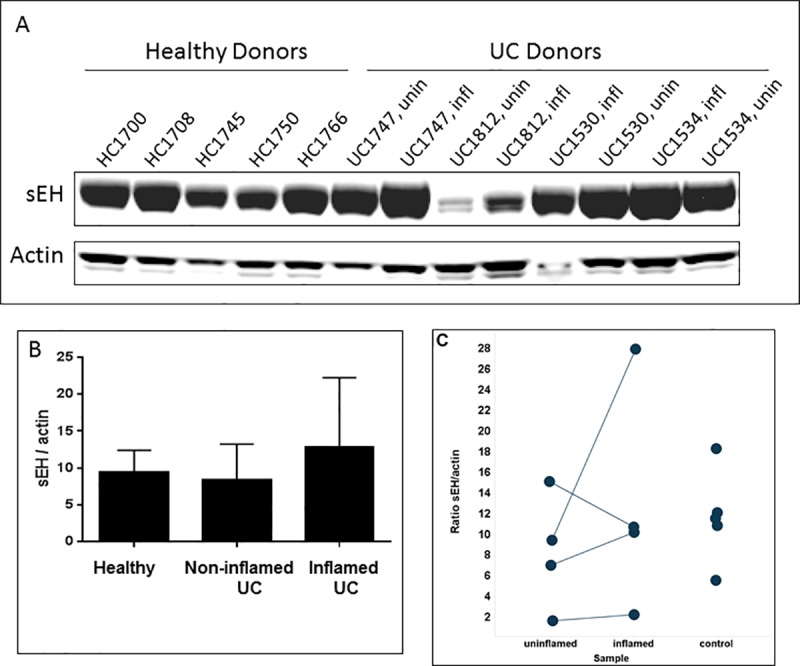
Fig 3. Western blot analysis for EPHX2 protein level in human colon.

Human colon samples were from healthy donors or UC donors. Each UC donor had matched uninflamed (unin) and inflamed (infl) biopsies. (A) Representative western blot results. (B) Normalized mean EPHX2 intensity vs. control actin from combined donors for each group. Data derived from duplicate western blot analyses with the same set of samples. Error bars represent standard deviations. Differences between groups were not statistically significant. (C) EPHX2/actin ratio for individual donors from each sample group. Differences between groups were not statistically significant.
