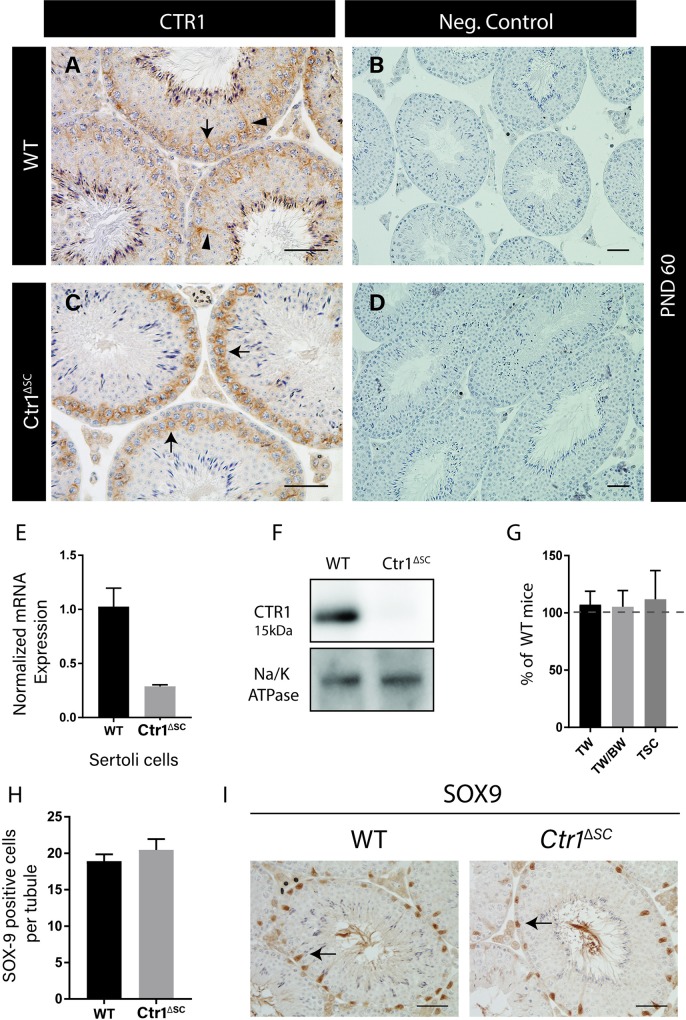
Fig 4. Ctr1ΔSC mice at PND 60 are indistinguishable from WT littermates.
Immunohistochemical analysis of CTR1 protein expression within the Ctr1ΔSC and WT testis. (A) CTR1 localization on within the seminiferous tubules in WT mice expressed on the SCs (arrowheads) and spermatocytes (arrow), and CTR1 localization on the spermatocytes only (arrows) in the Ctr1ΔSC testis (C). Negative secondary only control of WT and Ctr1ΔSC testis shown on the right (B and D, respectively). (E) Q-PCR on Ctr1 mRNA expression normalized to Hprt1 gene indicates up to 70% reduced expression in Ctr1ΔSC SCs compared to WT (average ± SEM). (F) Immunoblot analysis on crude membrane extract on WT and Ctr1ΔSC SC isolates against CTR1 antibody shows undetectable CTR1 expression in Ctr1ΔSC compared to WT mice. (G) Testicular weight (TW), testes to body weight ratio (TW/BW) and testicular spermatid head counts (TSC) all displayed similar to their WT littermates. The graph represents relative measurements of Ctr1ΔSC mice compared to WT mice, dashed line represents 100% of each measurement in WT mice (average ± SD). (H) SOX9-positive cells within the seminiferous tubules of both WT and Ctr1ΔSC testes displayed similar number of SCs. (I) Representative images of SOX9 staining indicated by arrows in both WT and Ctr1ΔSC testis. Each data point is representative of 4–5 mice of each genotype. Scale bar = 100 μm.

