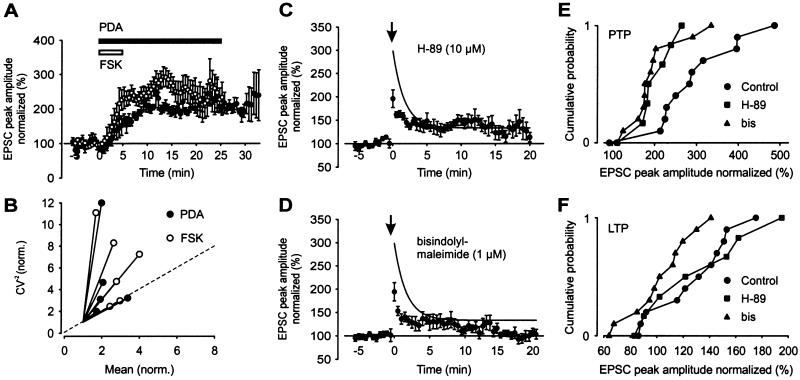
Figure 4.
Involvement of PKA and PKC pathways in aHFS-induced PTP and LTP of compound EPSCs. (A) Potentiation of compound EPSC amplitude (normalized to BT period) by bath application of 50 μM forskolin (○; six cells) and 1 μM PDA (●; five cells; horizontal bars indicate application times). (B) CV analysis of forskolin- (○) and PDA- (●) induced potentiation. The CV−2 of the EPSC amplitude 10–15 min (forskolin, two cells), 15–20 min (forskolin, four cells; PDA, one cell), and 20–25 min (PDA, four cells) after the onset of application was plotted against mean, both normalized to their respective control values. Location of the data points with respect to the identity line (dashed) suggests presynaptic changes. (C and D) Effects of single aHFS on compound EPSC amplitude after preincubation with 10 μM H-89 (C, seven cells) and 1 μM bisindolylmaleimide (D, 11 cells). The aHFS was applied at t = 0, as indicated by the arrow. Curves in C and D represent exponential function fitted to the control data points (0.1 mM EGTA) in Fig. 3 C and D (●; time constant 1.7 min). (E and F) Cumulative distributions of the extent of aHFS-induced PTP (E) and LTP (F) of compound EPSCs in individual experiments in control conditions (same experiments as shown in Fig. 3C), after preincubation with 10 μM H-89 (C), and one after preincubation with 1 μM bisindolylmaleimide (D).

