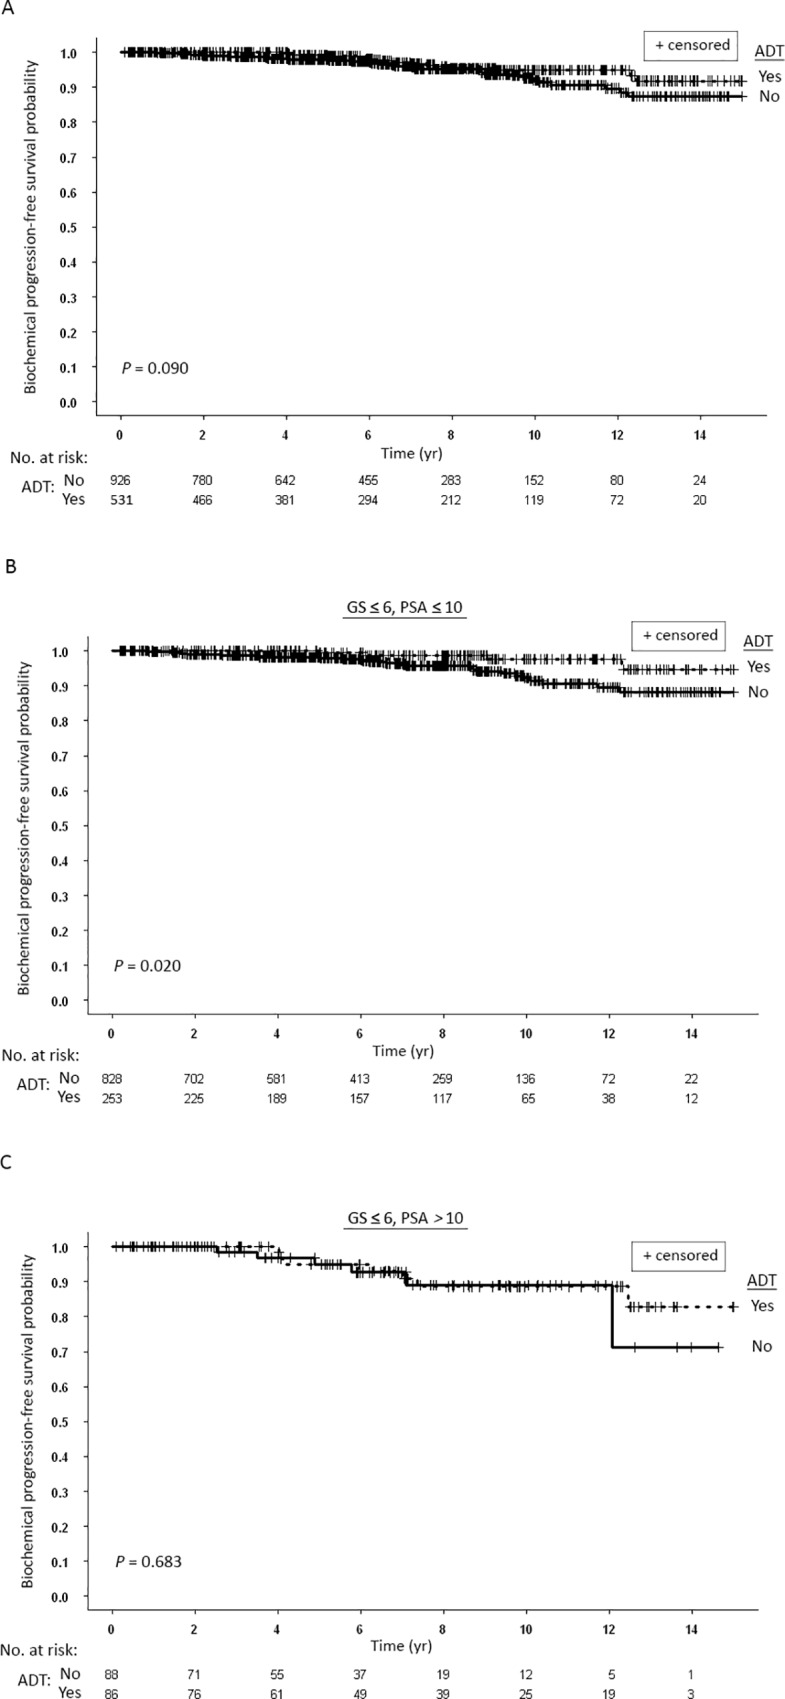
Fig 6.

(A) Kaplan-Meier curves for biochemical progression-free survival of all patients stratified according to whether they received (Yes) androgen deprivation therapy (ADT) or did not receive ADT (No). (B) Kaplan-Meier curves for biochemical progression-free survival of patients with Gleason score (GS) ≤ 6 and prostate-specific antigen (PSA) ≤ 10 ng/ml stratified according to whether they received (Yes) ADT or did not receive ADT (No). (C) Kaplan-Meier curves for biochemical progression-free survival of patients with Gleason score (GS) ≤ 6 and PSA > 10 ng/ml stratified according to whether they received (Yes) ADT or did not receive ADT (No).
