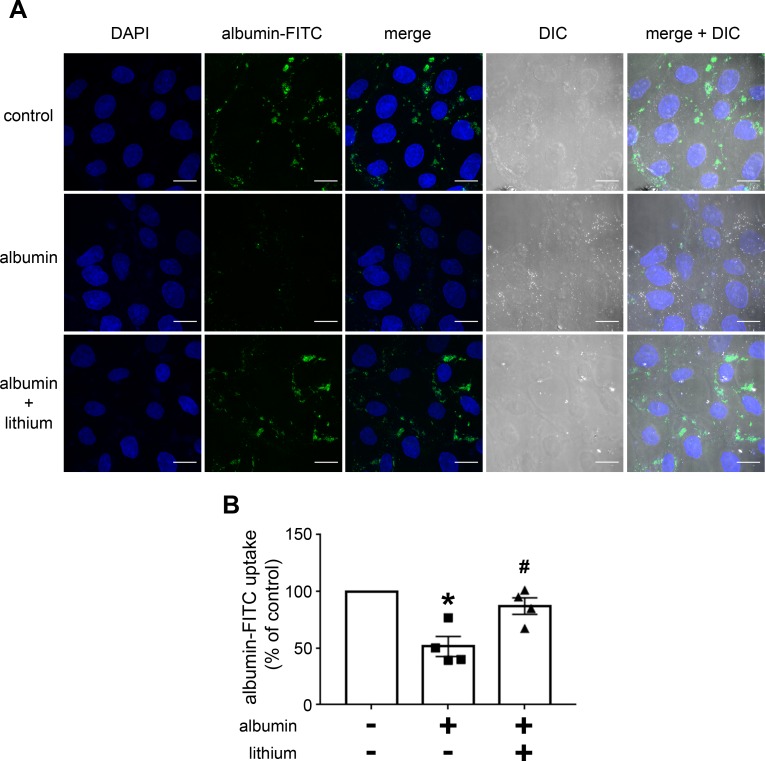
Fig 4. Lithium blockade of the inhibitory effect of high albumin concentration on albumin endocytosis in PT cells measured by confocal fluorescence microscopy.
The cells were pre-incubated with 20 mg/mL albumin and/or 20 mM lithium. A) Representative image. Green (BSA-FITC) indicates endocytic albumin, and blue (DAPI) indicates the cell nucleus. Scale bar represents 20 μm. DIC, differential interference contrast. B) Quantitative analysis (n = 4). The results are expressed as means ± SE. The control was taken as 100%. *P < 0.05 versus control (in the absence of lithium), #P < 0.05 versus albumin.

