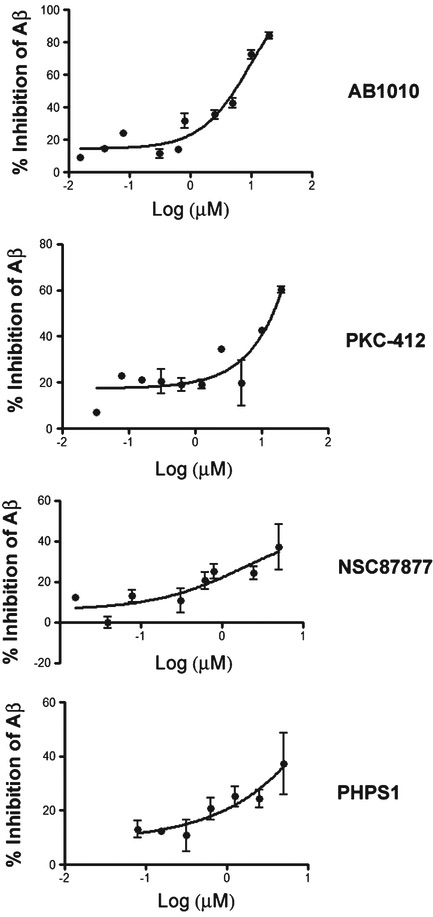
Fig. 10.
Dose response curve of cKit and Shp2 inhibitors on Aβ40 production. Concentration response curve of cKit inhibitors (PKC412, and AB1010) and Shp2 inhibitors (NSC87877 and PHPS1) on Aβ40 production as measured by ELISA in HEK293 cells stably overexpressing AβPP751. N=4 for each dose. Results were normalized to values obtained from cell viability assay by crystal violet staining. AβPP protein level is found to be linearly correlated to crystal violet staining (not shown). Results were normalized to % DMSO control.

