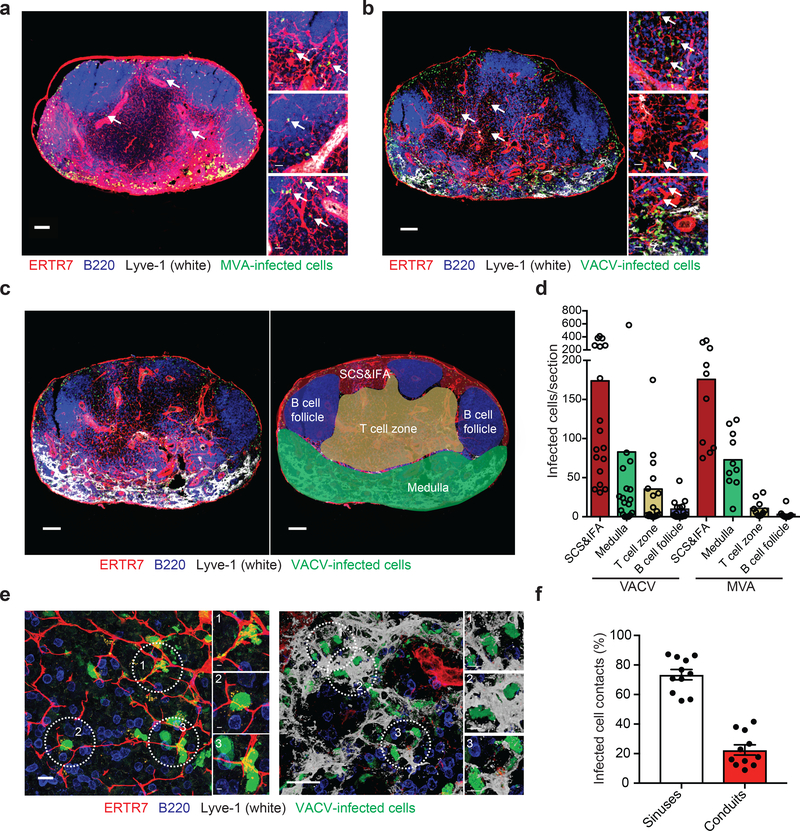
Figure 1. VACV and MVA rapidly infect T cell-zone cells associated with conduits.
a-b) Maximum intensity projections (MIP) of sections of popliteal LNs harvested 8 h after footpad injection 108 pfu of MVA (a) or VACV (b). ERTR7 = red (labeling conduits and blood vessels), Lyve-1 (labeling non-conduit lymphatic sinuses) = white, MVA or VACV-infected cells = green nuclear signal, B220 (labeling B cells) = blue. Arrows point to some of the virus-infected cells associated with conduits. Scalebar = 100 μm. Higher magnification images are shown to the right. Scalebars = 20 μm. (n =18 LN sections for VACV; 10 LN sections for MVA taken over 4–6 independent experiments) c) Schematic for assignment of LN regions into subcapsular sinus and interfollicular area region (SCS&IFA), B cell follicles, T cell zone, and medulla. Left = LN as stained in (a) and (b), right with areas overlaid. Scalebars = 100 μm. d) Quantitation of infected cells (either MVA or VACV) per LN section 8 h post-infection from sections in (a-b). Dots represent individual sections. Bars = mean. e) High magnification images showing the association of T cell-zone infected cells (green, nuclear) with conduits (red, left); or medullary infected cells associated with lymphatic sinuses (white, right). Scalebars = 20 μm. Individual infected cells that are highlighted in circles are shown in higher magnification on the right for each image. Scalebars = 3 μm (right insets) and 5 μm (left insets). f) Quantitation of the percentage of infected cells contacting either lymphatic endothelial cells (of LN sinuses) or conduits in the VACV sections (n=11, 3 independent experiments). Bars show mean. Scalebars = SEM.

