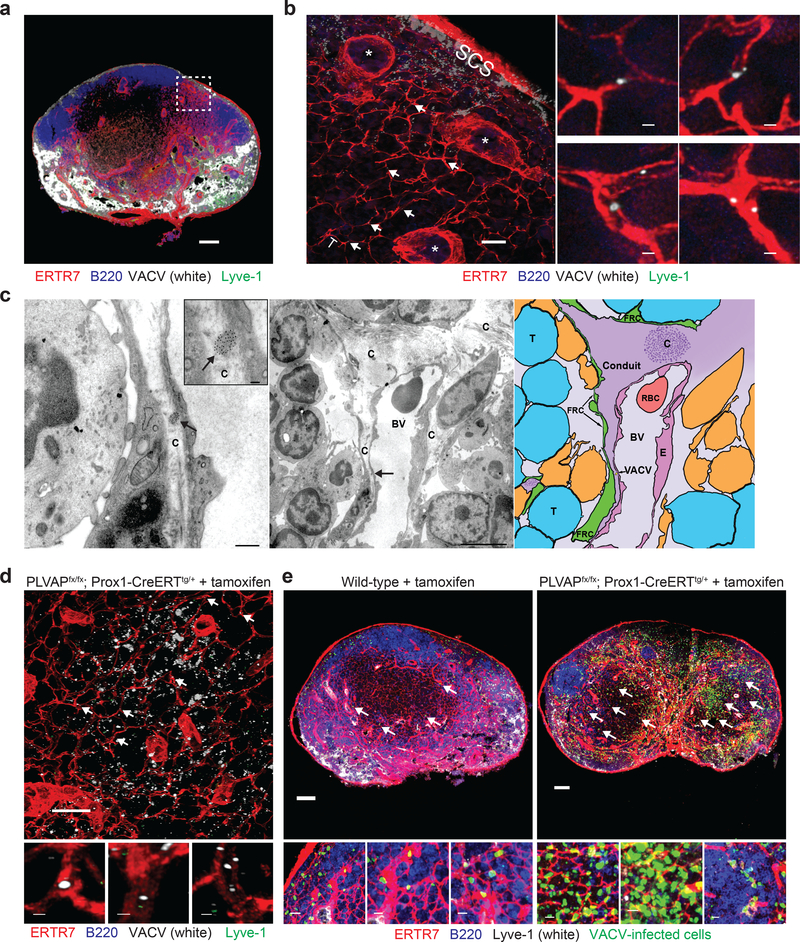
Figure 3. VACV virions can be transported in LN conduits.
a) Maximum intensity projection (MIP) of a popliteal LN section harvested 3 m after footpad injection of purified Alexa 647-labeled VACV (white) showing labeled virus in subcapsular and medullary sinuses (green). ERTR7 = red (labeling conduits and blood vessels), Lyve-1 (labeling non-conduit lymphatic sinuses) = green, Alexa 647-labeled VACV = white, B220 (B cells) = blue. The area shown in the dashed box is magnified in b). Scalebar = 100 μm. b) Blended projection of the boxed area of (a). Arrows point to some examples of labeled virions in conduits. Scalebar = 50 μm. * denote blood vessels. T = T cell zone. SCS = subcapsular sinus. Right panels show magnified images. Scalebar = 1 μm. Images in (a,b) are representative of 10 LNs taken in 4 separate experiments. c) Electron micrographs of popliteal LN harvested 5 m after footpad injection of 10 nm-gold-particle-conjugated VACV. Left panel) VACV virion in a conduit (labeled with a C) is indicated by an arrow. Scalebar = 500 nm. Inset shows a higher magnification of virion. Scalebar = 100 nm. Middle panel) Lower magnification of area in right panel showing typical down-spout like conduit (C) in the node. An arrow indicates the location of the virion. BV= blood vessel. Scalebar = 5 μm. Right panel) schematic of the image in the middle panel showing the VACV virion (gold) in the conduit (purple). Arrow indicates the location of the virion. The conduit is labeled “conduit”, T = T cell, FRC = fibroblastic reticular cell, RBC = red blood cell, E = endothelial cell, BV = blood vessel. An area of the conduit with collagen fibers running transverse to the LN section is indicated with a “C”. Results are indicative of 14 grids from 2 separate experiments. d) Alexa 647-labeled virus was injected footpad into tamoxifen-treated PLVAPiLECKO (genotype PLVAPfx/fx; Prox1-CreERT2tg/+) mice (depleting PLVAP on lymphatic endothelial cells (LECs)). ERTR7 = red (labeling conduits and blood vessels), Lyve-1 (labeling non-conduit lymphatic sinuses) = green, Alexa 647-labeled VACV = white, B220 (B cells) = blue. Arrows indicate some examples of labeled virus in conduits. Scalebar = 100 μm. Higher magnification images are shown in the insets below the image. Scalebar = 1 μm. Results are representative of 6 mice and 3 experiments. e) MIPs of sections of popliteal LN harvested 8 h post-footpad infection of wild-type mice treated with tamoxifen (left), or of transgenic animals with Plvap conditionally ablated in LECs (right). Arrows indicate some examples of virus-infected cells (green) in the T cell zone. Scalebars = 100 μm. Higher magnification images are shown below each node. Scalebars = 10 μm. ERTR7 = red (labeling conduits and blood vessels), Lyve-1 (labeling non-conduit lymphatic sinuses) = white, VACV-infected cells = green nuclear signal, B220 (labeling B cells) = blue. Results are representative of 9 mice and 3 experiments.

