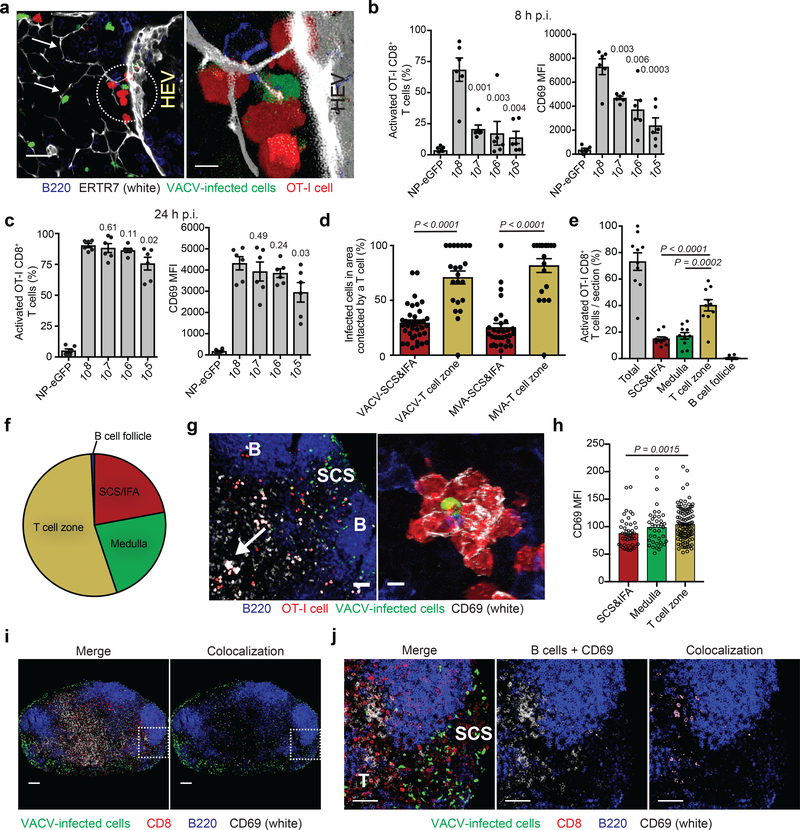
Figure 6. CD8+ T cells are rapidly activated by virus in the T cell zone.
a) Blended projections of T cells (red) clustered around a conduit (white)-associated VACV-infected cell (green) near a high endothelial venule (HEV, indicated in picture). Arrows point to conduits. Scalebar = 20 μm. Area in circle is magnified on the right. Scalebar = 5 μm. ERTR7= white, VACV-infected cells = green, OT-I CD8+ T cells = red, B220 = blue. Results are representative of 30 LN sections taken from 5 experiments. b) OT-I CD8+ T cell activation as determined by flow cytometry of single-cell suspensions of popliteal LNs harvested 8 h p.i. 106 OT-I cells were transferred 12–24 h prior to infection. NP-eGFP (no SIINFEKL) was given at 107 pfu; all other infections used NP-S-eGFP (containing SIINFEKL) at the indicated dose. Activation was determined by CD69 expression. MFI is shown on the right. Dots = individual LNs. n = 6. Results were repeated 3 times with 3–6 mice/group. Bars = mean. Error bars = SEM. c) OT-I CD8+ T cell activation in (b) but 24 h p.i. Dots = individual LNs. n = 6. Results were repeated 3 times with 3–6 mice/group. Bars = mean. Error bars = SEM. d) Quantitation of the percentage of VACV- or MVA-infected cells in either the SCS and IFA region or T cell zone contacted by OT-I CD8+ T cells (n = 37 VACV or 32 MVA; dots indicate individual sections). Bars = mean. Error bars = SEM. e) Percentage of activated OT-I CD8+ T cells (those with CD69 MFI > 50) in each region of 10 LN sections harvested 8 h after infection with 108 pfu VACV. Percentages shown are activated cells/total cells in each region. Dots = individual LN sections. Bars = mean. Error bars = SEM. f) Percentage of only the activated OT-I CD8+ T cells (as opposed to total cells in (e)) found in each LN region. g) MIP LN section 8 h p.i. showing OT-I CD8+ T cell activation. B = B cell follicle, SCS = subcapsular sinus. Arrow indicates activated T cell cluster in the T cell zone, magnified on the right. Scalebars = 50 μm, left and 5 μm, right. OT-I CD8+ T cells = red, CD69 = white, VACV-infected cells = green, B220 = blue. h) MFI of CD69 on all activated cells in each region of the popliteal LN shown in (g). n =197 T cells. Bars = mean. Error bars = SEM. i) MIP of popliteal LN harvested 8 h post infection with 108 pfu VACV (green) without OT-I transfer. Endogenous, polyclonal CD8+ T cells = red. Colocalization of polyclonal CD8+ T cell signal (red) and CD69 (white) signal is shown in purple. B220 = blue, VACV-infected cells = green. The boxed area is magnified in (j). scalebars = 100 μm j) Higher magnification MIP image of (i) showing both the SCS&IFA (labeled SCS) and T cell zone (T). Colocalization of polyclonal CD8+ T cell signal (red) and CD69 (white) signal is shown in purple. scalebars = 50 μm. f,h,i,j) 6 LNs from 3 experiments were analyzed. g) 10 LNs from 5 experiments were analyzed. Statistics = unpaired two-tailed t test.

