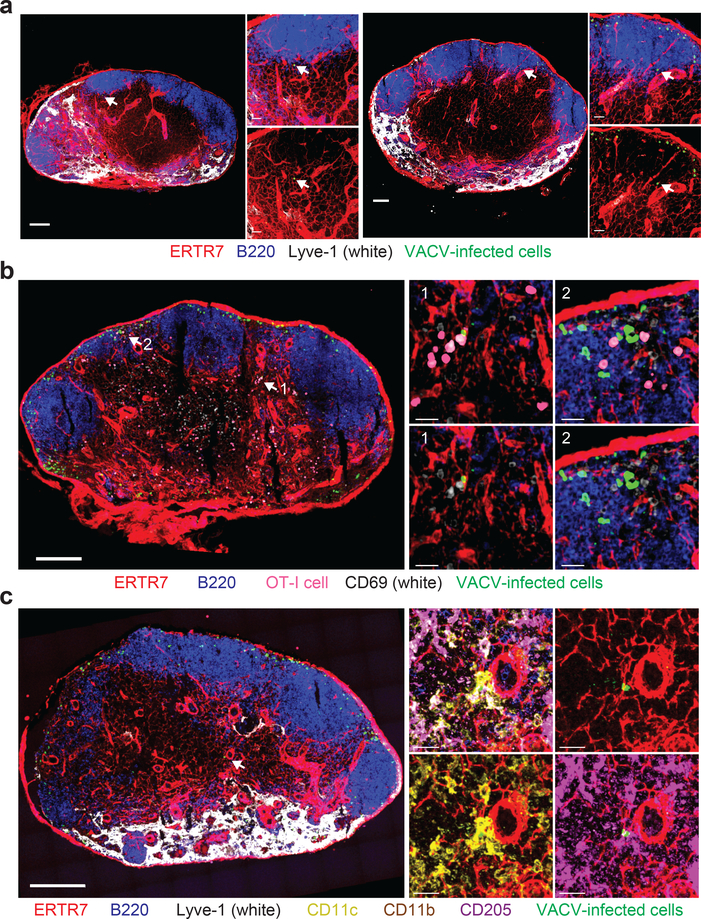
Figure 7. VACV infects paracortical DCs at lower viral doses.
a) Maximum intensity projection (MIPs) of sections from two different popliteal LNs (left and right) harvested 8 h after footpad injection of 106 pfu of VACV. ERTR7 = red, Lyve-1 = white, VACV-infected cells = green, B220 = blue. Arrows indicate the location of VACV-infected paracortical cell. scalebars = 100 μm. Higher magnification images are shown on the right; lower panels lack the blue channel for clarity. Scalebars = 50 μm. Results are representative of 10 LNs from 3 experiments. b) MIP of a section of a popliteal LN harvested 8 h after footpad injection of 106 pfu of VACV. Prior to infection, 106 OT-I CD8+ T cells were transferred (pink). ERTR7 = red, B220 = blue, CD69 = white, VACV-infected cells = green. Arrows indicate two areas of T cell activation that are shown in higher magnification insets on the left. Scalebar = 200 μm. Top panels of insets show merge; bottom panels do not show OT-I signal (pink) in order to reveal CD69 staining more clearly. Scalebars = 20 μm. Results are representative of 10 LNs from 3 experiments. c) MIP of a section of a popliteal LN harvested 8 h after footpad infection with 106 pfu of VACV showing an infected paracortical CD205+ DC. Scalebar = 200 μm. Higher magnification images are shown in the insets showing: top left) merge; top right) conduits + VACV-infected cells; lower left) conduits + VACV-infected cells + CD11c + CD11b; lower right) conduits + VACV-infected cells + CD205. Scalebar = 20 μm. ERTR7 = red, Lyve-1 = white, VACV-infected cells = green, B220 = blue, CD11c = yellow, CD205 = purple, and CD11b = brown. Results are representative of 10 LNs from 3 experiments.

