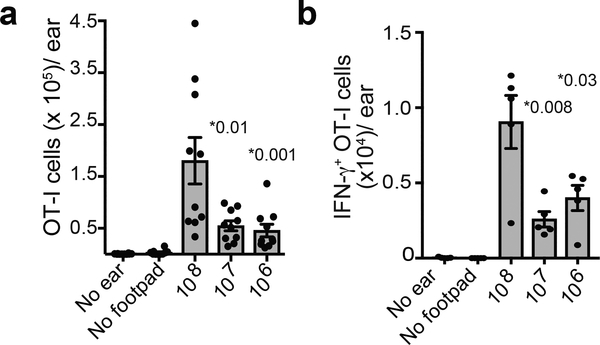
Figure 8. T cells activated at the highest viral doses traffic rapidly to the infected tissue.
a) Number of T cells in the ear at the indicated viral dose. (For no ear, only footpad infection was given. For no footpad, only ear infection was given). Dots show individual ears. n = 10 ears from 5 mice. b) Number of IFN-γ producing OT-I CD8+ T cells in the ear after infection with indicated viral dose. Note that for these experiments, mice were infected in the ear pinna with VACV expressing SIINFEKL 24 h after footpad infection. Dots show individual animals. n = 5 ears from 5 mice. Statistics = unpaired two-tailed t test. For a and b, results were repeated 3 times with 5 mice/group.

