Figure 6.
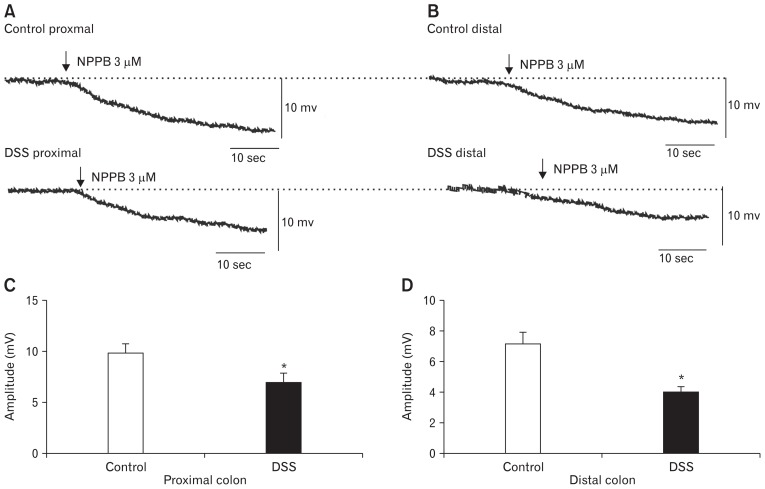
The responses to the anoctamin-1 antagonist (NPPB) in colonic smooth muscle cells of control and dextran sodium sulfate (DSS)-colitis mice. (A, B) The responses of the membrane potentials to the NPPB in proximal and distal colonic smooth muscle cells (NPPB, 3 μM, arrow). (C, D) Summary of the data showing the average effects of NPPB on membrane potentials in both control and DSS-colitis colonic SMCs (n = 7/group; *P < 0.05).

