Figure 7.
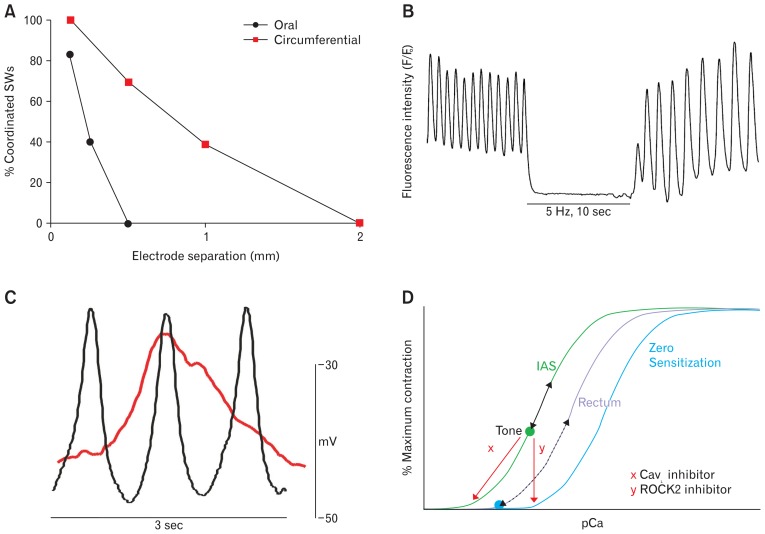
Examples of electromechanical coupling behaviors in the internal anal sphincter (IAS; A–C) that give rise to tone and their possible relationship to myofilament sensitization (D). (A) Summation of asynchronous phasic activity. Microelectrode studies in the mouse IAS reveal significantly greater coordination of slow waves (SWs) in the circumferential (red squares) than in the oral (black circles) direction indicating that the IAS does not behave as a “single unit.” Instead, asynchronous (aka uncoordinated) phasic activity is present that will sum to generate tone (adapted from Hall et al16 with permission). (B) Partial tetanus. Calcium imaging studies in the SM-GCaMP3 mouse IAS reveal high frequency Ca2+ transients (fluorescence intensity) at the SW frequency (75 cpm). When contraction is abolished with electrical field stimulation (EFS) of nerves125 cytoplasmic Ca2+ declines significantly indicating that it is normally elevated when tone is present. These data26,73 support a partial tetanus-type mechanism as described in the text. (C) Window current. Superimposed SW recordings from the mouse (black) and monkey (red) IAS reveal that while SW frequency is greater in the mouse membrane potential (Em) remains depolarized over a greater period of time in monkey. These conditions result in greater window current in monkey that will contribute to tone development. (D) Myofilament sensitization. Cartoon depicting the possible relationship between myofilament sensitization, electromechanical coupling and contraction in the IAS and rectum. Plotted is percent maximum contraction as a function of intracellular Ca2+ concentration (pCa) for the IAS (left), rectum (middle), and for zero myofilament sensitization (right). The IAS curve is to the left of rectum because of greater myofilament sensitization.42 pCa remains elevated in the IAS (green dot) since resting Em is more depolarized and SW frequency is greater than in rectum.16,33 Elevated pCa will give rise to tone. Fluctuations in pCa above the green dot with each SW (black arrow, left curve) will result in phasic contractions superimposed upon tone. The overall fluctuations in pCa in the tissue will be dampened by asynchronous activity in adjacent muscle bundles. The pCa/contraction curve for rectum is depicted to the left of zero sensitization since there is also some myofilament sensitization in rectum.91 pCa between SWs in rectum (blue dot, middle curve) is less than in the IAS (green dot, left curve) because resting Em is more negative and SWs occur at a lower frequency. With each SW, pCa transiently rises (dashed arrow, middle curve) generating a phasic contraction. Tone can develop in the rectum if depolarization is sustained (eg, elevation of extracellular potassium concentration78). Blockade of L-type Ca2+ channel (CavL)-dependent Ca2+ entry (eg, nifedipine [x]) decreases pCa and abolishes contraction in both muscles. In contrast, blockade of Rho-associated protein kinase 2 (ROCK2) activity (eg, Y27632 [y]) shifts the pCa/contraction curve of both muscles toward zero sensitization, again abolishing (or greatly diminishing) contraction.

