
Figure 2:
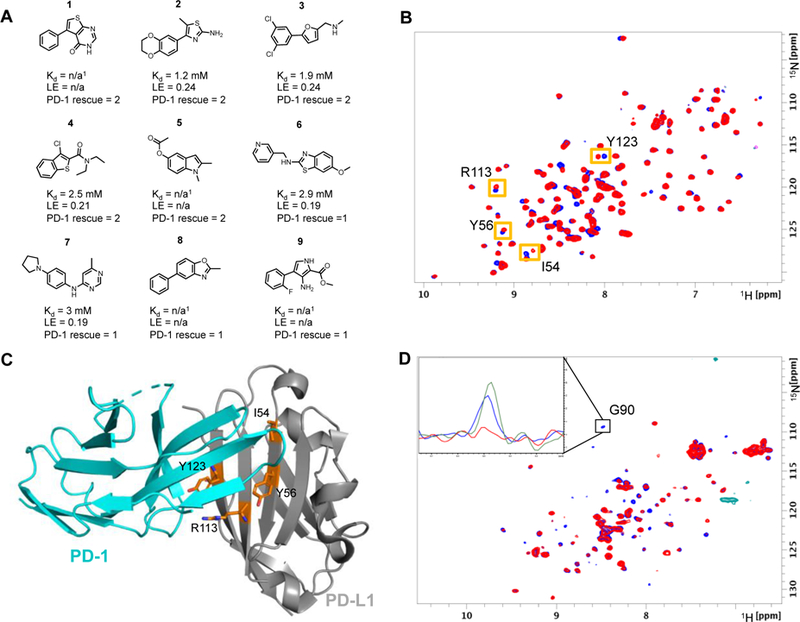
A) Selected fragment hits identified in the fragment screen that displace PD-1. PD-1 rescue score is based on the percent of G90 signal rescued of 15N labeled PD-1 at 800 µM fragment concentration. Score 1 indicates 1 – 15% signal rescue and score 2 indicates > 15% signal rescue. 1Kd values could not be determined due to solubility limits and/or peak broadening. B) SOFAST HMQC spectra of PD-L1-6His-H140E in the absence (blue) and presence of 800 µM fragment #2 (red). Shifted peaks and corresponding amino acid are indicated by orange boxes. C) X-ray structure of PD-1 bound to PD-L1 with highlighted residues (orange sticks) that have resonance perturbations from HMQC spectra suggest fragments bind to PD-L1 at the PD-1 binding site (PDB Code: 4ZQK). D) NMR based ADIA assay showing fragment displace PD-1 from PD-L1. HMQC PD-1 spectrum is broadened by the addition of unlabeled PD-L1 (red). Rescue of signal intensity by addition of 2 mM of fragment 1 (blue) suggests fragment 1 displaces PD-1 from PD-L1. Inset 1D slice of the HMQC spectra shows rescue of signal intensity from G90 of PD-1. The peak intensity is broadened by the addition of 14N PD-L1 (red) compared to 15N PD-1 alone (green). Addition of 2 mM of fragment 1 rescues approximately 75% of the signal intensity (blue).