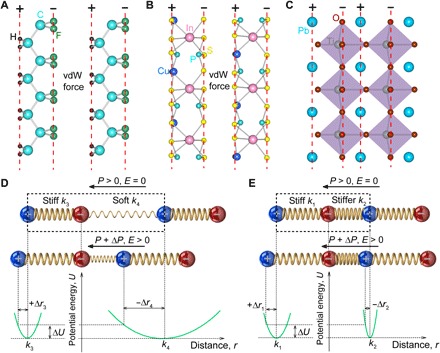
Fig. 3. Simplified rigid ion model for piezoelectricity in polar solids.

(A to C) Correlations between crystal structures and dipole charges for PVDF (A), CIPS (B), and PZT (C). (D) Negative piezoelectric effect in polar solid with discontinuous (broken) lattice. (E) Positive piezoelectric effect in polar solid with continuous lattice. The unit cell of the lattice is indicated by the dashed box. The polarization and electric field directions are denoted by the arrows. The lower parts show the pair potential energy profiles of the corresponding chemical bonds. The negative ions are taken as a reference point for the relative changes of bond lengths.
