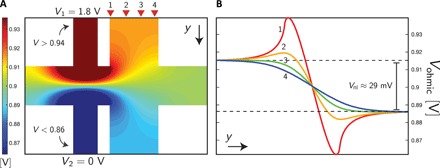
Fig. 3. Electric potential mapping from a SPICE-based resistor network simulation.

(A) SPICE simulation of a resistor grid with ~4 × 10⁶ uniform resistors, where each resistor corresponds to ~3-nm channel length, with (x = 1500, y = 1400) points. Vds values applied at the two ends of the injector are V1 = 1.8 V and V2 = 0 V, respectively. Values greater than 0.94 V and less than 0.86 V are denoted with the same colors to resolve the nonlocal voltage distribution. (B) Voltage profiles along the y direction for four different positions denoted by arrows (1 to 4) in (A). Nonlocal voltage difference under open circuit condition is calculated to be ~29 mV.
